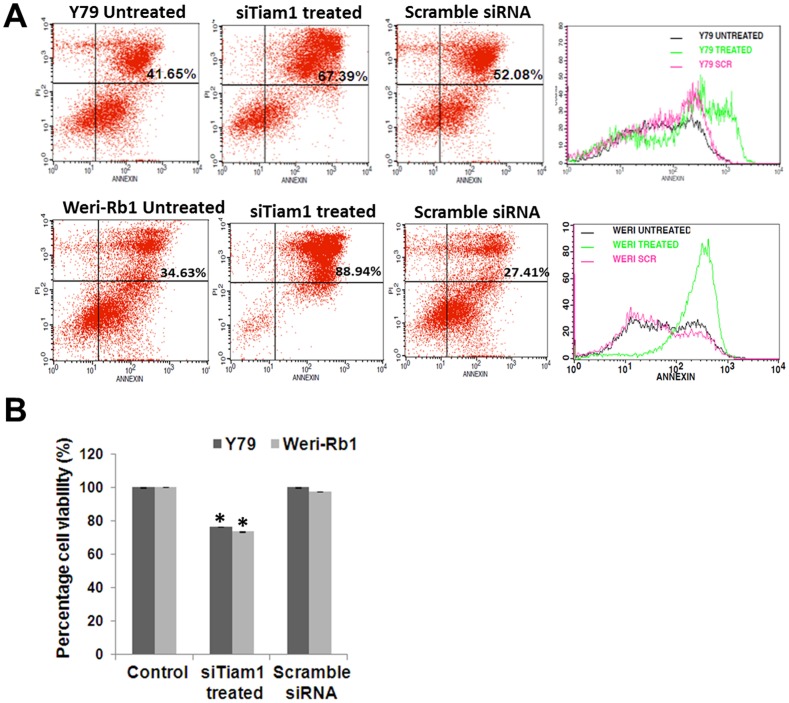
Figure 3. Analysis of Apoptosis and viability of Tiam1 silenced Y79 and Weri-Rb1 cells.
A. invitro cell apoptosis assay showing the difference in mean fluorescence intensity between Tiam1 siRNA treated and Scrambled siRNA treated Y79, Weri-Rb1 cells. On the right panel, overlay graph showing the Annexin V expression between the samples. B. MTT assay showing the significant reduction in cell viability in Tiam1 silenced RB cell lines. Error bar represents the standard deviation of triplicates value and the statistical analysis was calculated using students unpaired t-test and p<0.05 is indicated as asterisk.

