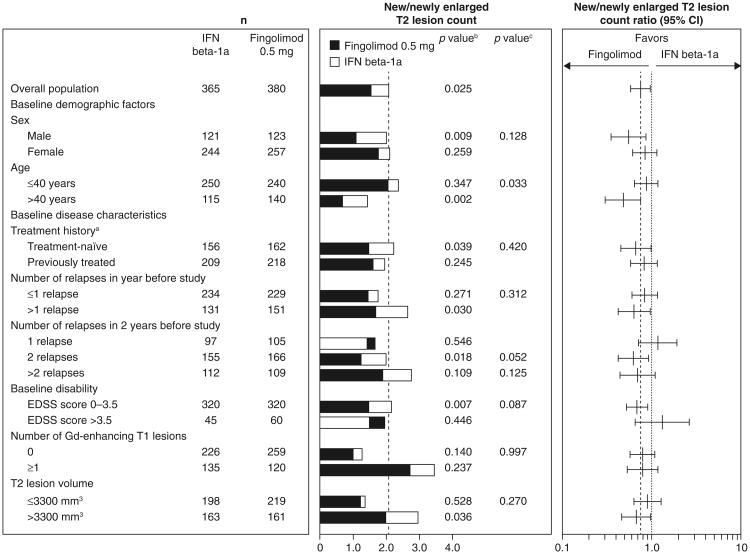
Fig. 3.
New/newly enlarging T2 lesion counts and ratios over 12 months in patient subgroups defined by demographic factors and baseline disease characteristics (intent-to-treat population). New/newly enlarged T2 lesion counts were estimated using a negative binomial regression model, log-link, adjusted for treatment for the overall result, and adjusted for treatment subgroup and treatment by subgroup variable interaction for the subgroup analyses. n number of observations included in the analysis (patients with non-missing new/newly enlarged T2 lesion count assessments at month 12). aPatients were categorized according to whether they were treatment-naïve (had received no form of medication for MS before the study) or had previously received treatment for MS with any medication at any time before study enrollment. bp value for the treatment contrast within the subgroup. cp value for the treatment by subgroup interaction, which evaluates heterogeneity of the treatment effect (see “Methods”). EDSS expanded disability status scale, Gd gadolinium, IFN interferon, MS multiple sclerosis

