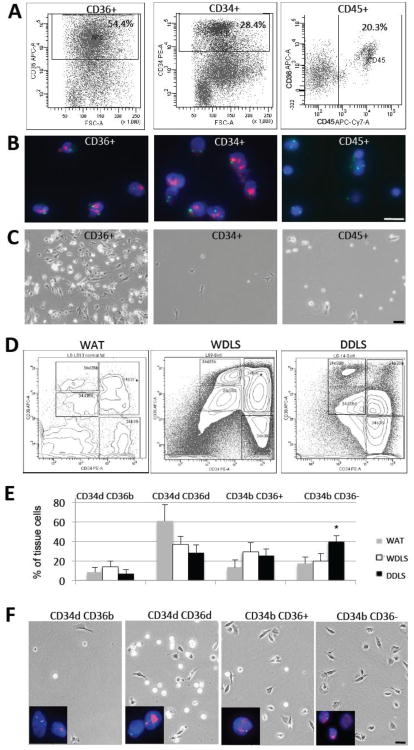
Figure 2.
Characterization of WDLS and DDLS populations. (A) FACS separation of cells based on the expression of CD36, CD34, and CD45 in a representative WDLS. Percentages of cells positive for a marker among viable cells are indicated. (B) Identification of malignant cells through the detection of the 12q15 amplification (red) by FISH in CD36+ and CD34+ cells. (C) Morphology of cells sorted based on the expression of CD36, CD34, or CD45 from the WDLS tumor upon adherence. In (B-C), WDLS cells isolated in (A) were used. (D) FACS 3D contour graphs for representative samples of benign WAT, as well as for WDLS and DDLS samples analyzed in Fig. 1 (B). Gates for CD34dCD36d, CD34dCD36b, CD34bCD36-, and CD34bCD36+ cells are shown. (E) Percentages among viable cells analyzed in multiple samples were calculated for normal WAT, WDLS and DDLS (N=5 for each). Mean frequencies of each population +/- SD among viable tumor cells in are shown. * P<0.05. (F) Morphology of cells sorted in (D) from a representative DDLS sample upon plastic adherence in culture. FISH detecting the 12q15 amplicon (red) confirms cells in the four populations as malignant. Green: centromeric probe; blue: DAPI. Scale bar: 50 μm.

