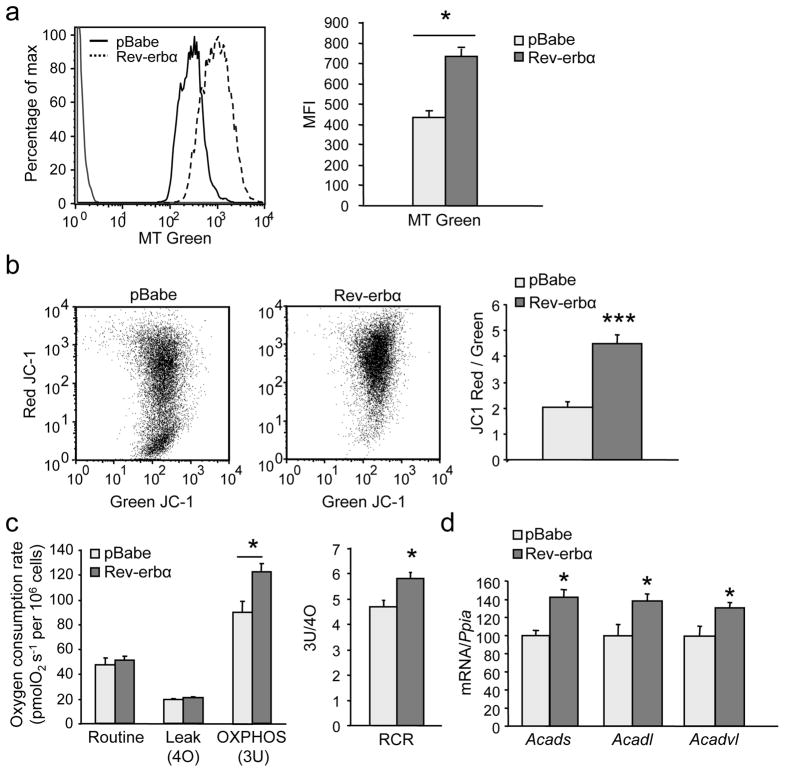
Figure 3. Rev-erb-α modulates mitochondrial respiration.
(a) Mitochondria content in Rev-erb-α-expressing (Rev-erbα) or control (pBabe) retrovirus infected C2C12 cells by flow cytometry analysis of green mitotracker (MT) staining (Left, representative histogram; Right, mean fluorescence intensity (MFI)) (n = 6 per condition). (b) Functional mitochondria content by flow cytometry analysis of JC–1 (Left) and JC1red/JC1green (i.e. high/low mitochondrial membrane potential) MFI ratio (Right) (n = 6 per condition). (c) Oxygen consumption in Rev-erbα and control pBabe cells (n = 5 per condition). (d) RT-qPCR analysis of fatty acid oxidation gene expression in differentiated C2C12 cells infected with Rev-erbα or control (pBabe) retrovirus (n = 6 per group). Results are expressed as means ± sem; *P < 0.05, *** P < 0.001 by unpaired t-test.

