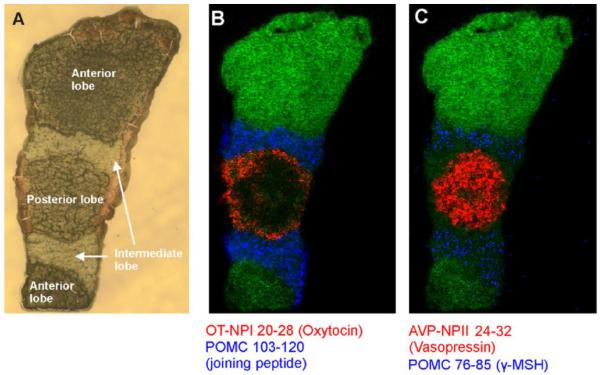
Figure 5. Neuropeptide MSI of a Mouse Pituitary Gland.
(a) An optical image of a pituitary shows that the localization of (b) oxytocin (red), joining peptide (blue), (c) vasopressin (red), and γ-MSH (blue) can be segregated to specific lobes. Reprinted with permission [93].

