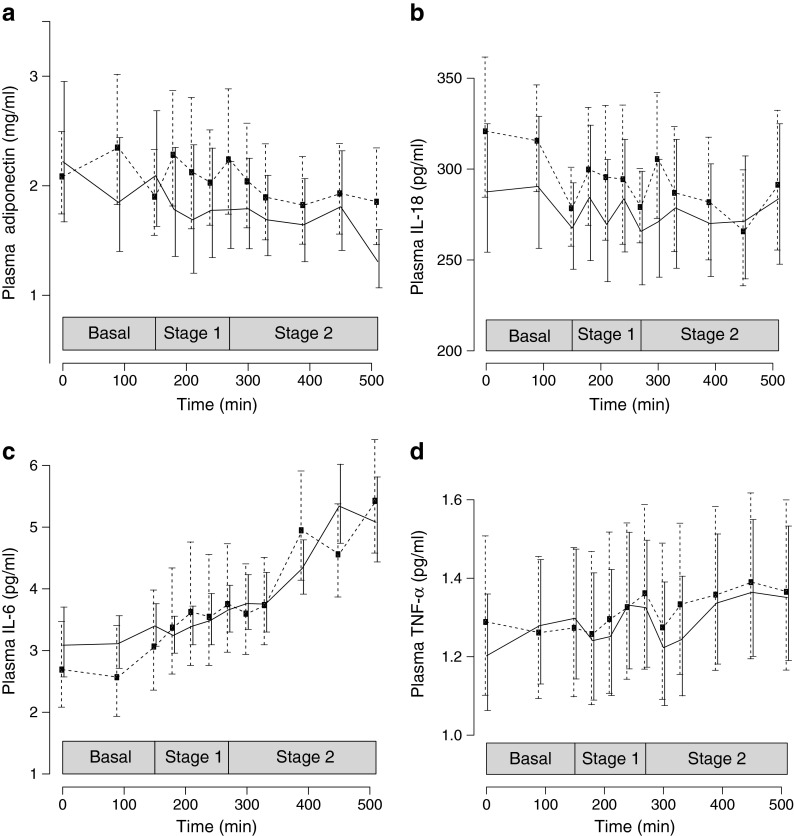
Fig. 1.
(a) Geometric means ± SEM for plasma adiponectin, (b) plasma IL-18, (c) plasma IL-6 and (d) plasma TNF-α levels during the basal stage, low-dose insulin infusion (stage 1) and high-dose insulin infusion (stage 2) after overnight treatment with placebo (dashed lines) and acipimox (solid lines) in nine HIV-infected patients with lipodystrophy. The full statistical model for all four cytokines has four main effects: treatment, insulin, time during stage 1 and time during stage 2. It has three interaction terms: treatment with insulin, time during stage 1 and time during stage 2. The final models were reduced to only retain those terms significant at a 5% confidence level. The statistical results appear as: (1) the effect of acipimox or placebo (treatment, main effect); (2) low or high-dose insulin infusion (insulin, main effect); and (3) time during the different stages of the clamp (time effect); and they allow (4) for an interaction between treatment, insulin and time. The main effect of treatment was only significant for adiponectin (p = 0.0001) (a) and IL-18 (p < 0.0001) (b), and was thus removed from the final models of IL-6 (c) and TNF-α (d). Likewise, the main effect of insulin was only significant for adiponectin (p < 0.0001) (a) and IL-6 (p < 0.0001) (c), and was thus removed from the final models of IL-18 (b) and TNF-α (d). Time was only significant during stage 1 for TNF-α (p = 0.024) (d), and during stage 2 for IL-18 (p = 0.046) (b) and IL-6 (p = 0.0001) (c). The time effects were removed in all other cases. Only one interaction term was retained, namely the interaction between treatment and time during stage 2 for IL-18 (p = 0.023) (b). In total, nine main effects and 11 interaction terms were removed from the final models

