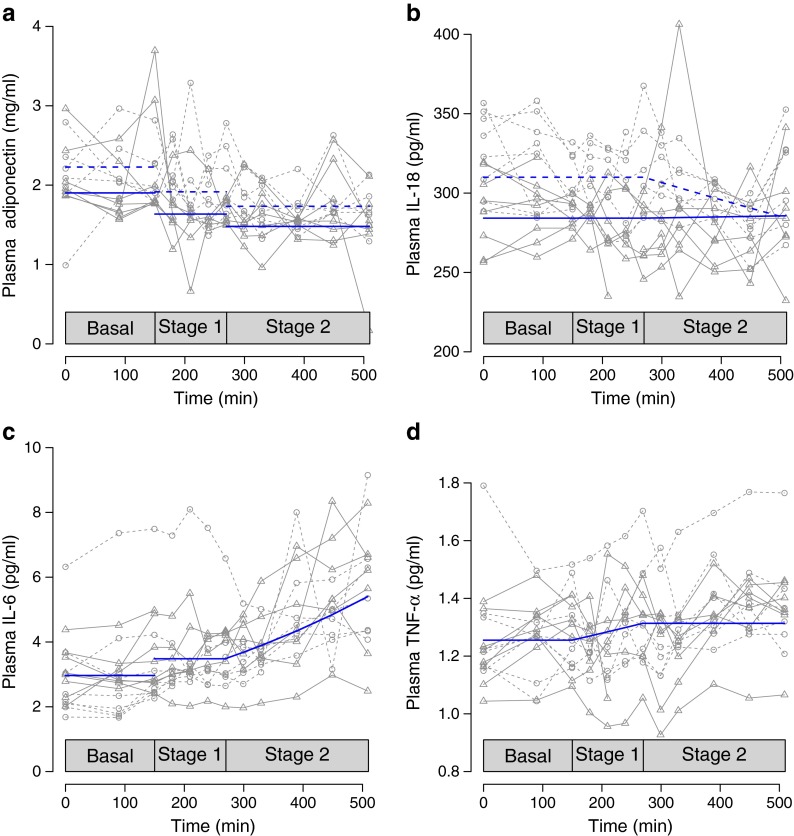
Fig. 2.
The predicted levels from the final statistical model of (a) plasma adiponectin, (b) plasma IL-18, (c) plasma IL-6 and (d) plasma TNF-α during the basal stage, low-dose insulin infusion (stage 1) and high-dose insulin infusion (stage 2) after overnight treatment with placebo (blue dashed lines) and acipimox (blue solid lines) in nine HIV-infected patients with lipodystrophy. For IL-6 and TNF-α the solid lines are predicted values irrespective of treatment status, as no treatment effect was detected. Lines with slopes different from zero indicate a statistically significant cumulative effect of insulin over time beyond the instantaneous effect of a change in insulin infusion. A statistically significant effect of a changed insulin level is shown by discontinuous lines. Note that only one interaction (insulin × time × treatment) term was retained, namely for IL-18 during high insulin infusion, where the effect of insulin depends on treatment status. Grey symbols indicate observed values (squares during placebo, triangles during acipimox treatment), and grey lines connect measurements from the same participant and day during placebo (dashed grey lines) and during treatment (solid grey lines). The main effect of treatment was only significant for adiponectin (p = 0.0001) (a) and IL-18 (p < 0.0001) (b), and was thus removed from the final models of IL-6 (c) and TNF-α (d). Similarly, the main effect of insulin was only significant for adiponectin (p < 0.0001) (a) and IL-6 (p < 0.0001) (c), and was thus removed from the final models of IL-18 (b) and TNF-α (d). Time was only significant during stage 1 for TNF-α (p = 0.024) (d), and during stage 2 for IL-18 (p = 0.046) (b) and IL-6 (p = 0.0001) (c). The time effects were removed in all other cases. Only one interaction term was retained, namely the interaction between treatment and time during stage 2 for IL-18 (p = 0.023) (b). In total, nine main effects and 11 interaction terms were removed from the final models

