
Figure 5.
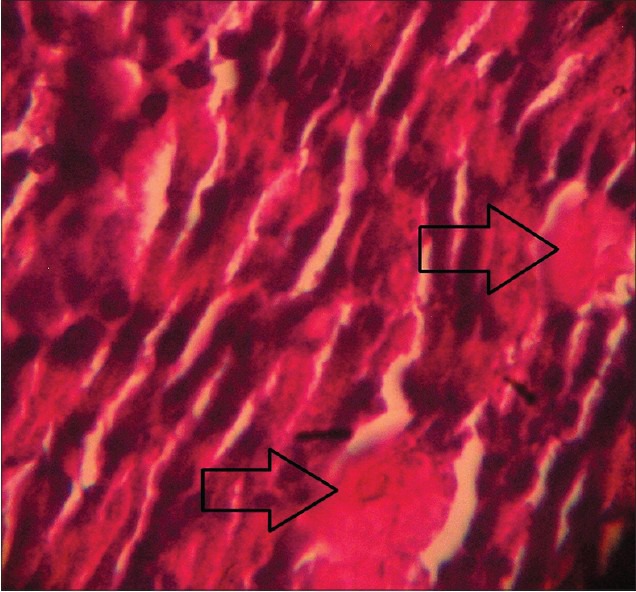
Histopathological picture of pancreas of STZ-induced diabetic rat after 4 weeks treatment with WCDF extract (1000 mg/kg) showing a trend of recovery of pancreatic beta cell destruction as indicated by arrow (Group 3) (H and E, ×40)
Official websites use .gov
A
.gov website belongs to an official
government organization in the United States.
Secure .gov websites use HTTPS
A lock (
) or https:// means you've safely
connected to the .gov website. Share sensitive
information only on official, secure websites.
Histopathological picture of pancreas of STZ-induced diabetic rat after 4 weeks treatment with WCDF extract (1000 mg/kg) showing a trend of recovery of pancreatic beta cell destruction as indicated by arrow (Group 3) (H and E, ×40)