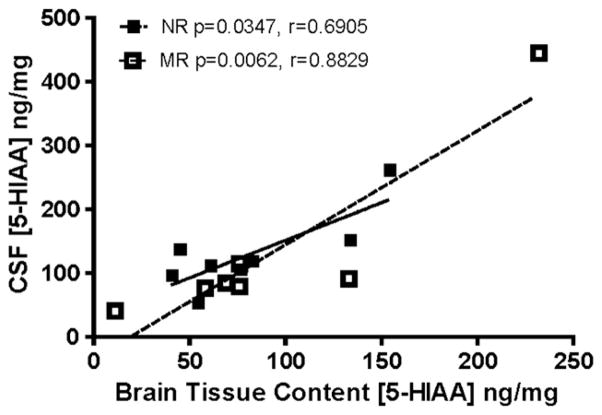
Fig. 4.
Both NR (closed squares, solid line) and MR (open squares, dashed line) groups yielded significant correlations between 5-HIAA concentrations in cerebrospinal fluid (CSF) and 5-HIAA concentrations in brain tissue when analyzed separately. Solid lines are linear regressions of the data points by rearing condition. There was also an overall correlation across all subjects (r = 0.6613, p = 0.0036). N = 15 within-subject paired observations, subjects lacking paired CSF and tissue content samples were excluded (one per treatment).

