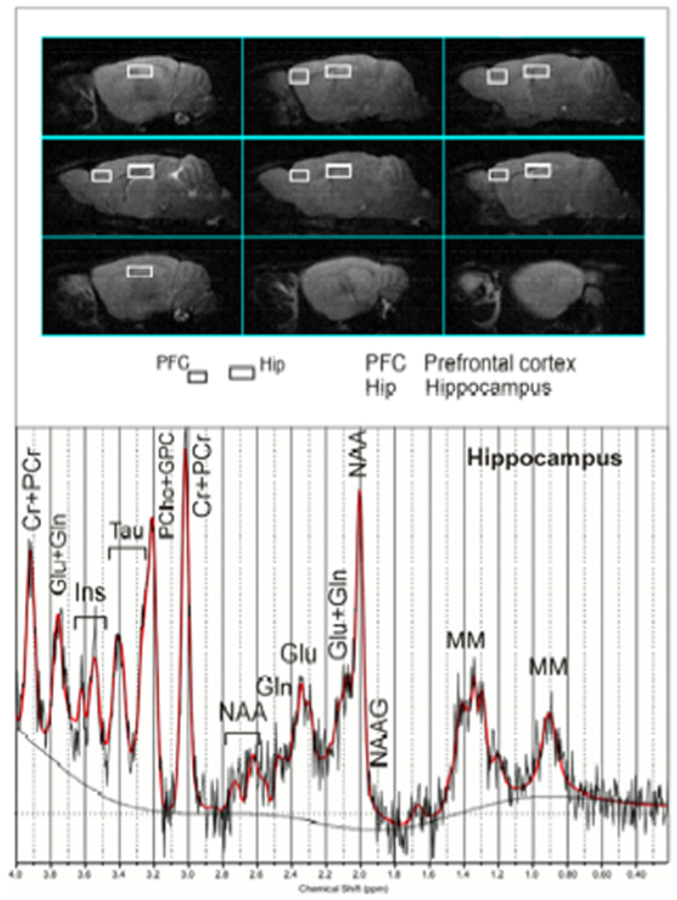
Figure 8. MRI panel: Example of in vivo sagittal T2-weighted spin-echo images (TR/TE = 3000/70 ms, slice thickness 0.8 mm, NS = 2, FOV = 20 × 20 mm2, matrix 128 × 128).
Voxels localised on PFC and Hip are indicated by the white rectangles. MRS panel – Examples of in vivo 1H spectra (as a black trace), acquired from the Hip (PRESS, TR/TE = 4000/23 ms, NS = 256). The result of LCModel fit is shown as a red trace overimposed on the spectrum. Metabolite assignments: Ins, inositol; Cr, creatine; PCr, phospho-creatine; Glu, glutamine; Gln, glutamate; Tau, taurine; PCho, phospho-choline; GPC, glicero-phospho-choline; NAA, N-acetyl-aspartate; NAAG, N-acetyl-aspartyl-glutamate; MM, macromolecules.

