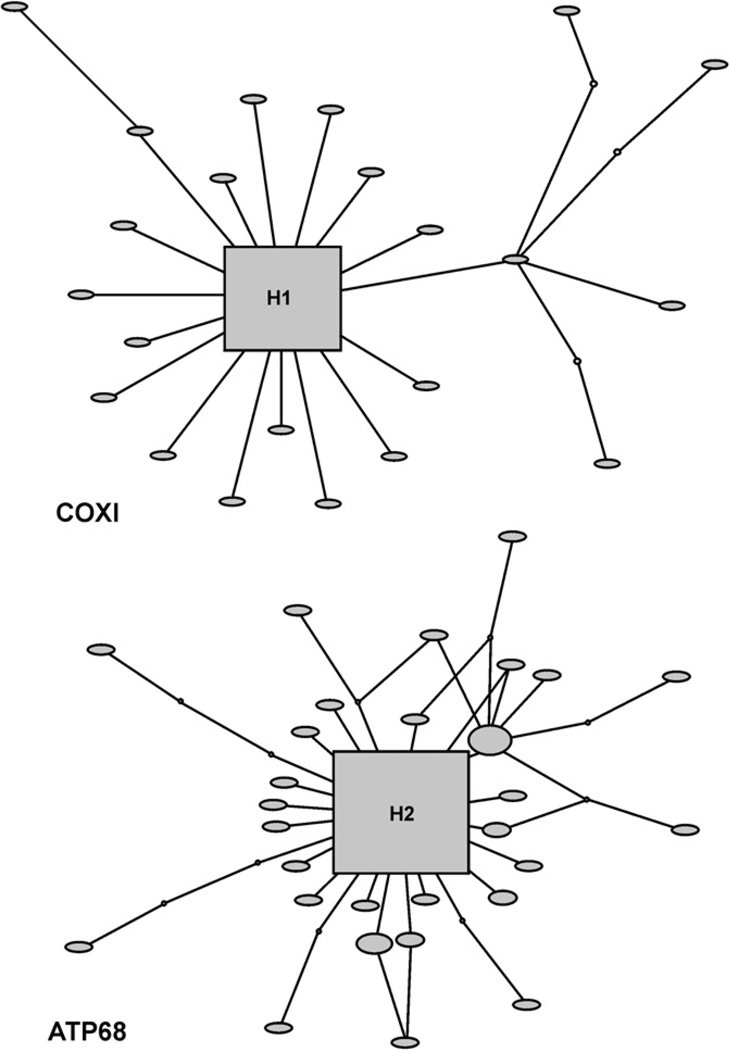
Fig. 3.
Haplotype network for H. bivittatus COX1 (top) and ATP68 (bottom) gene regions. Square represents the ancestral haplotype, filled circles observed haplotypes, and small circles inferred intermediate haplotypes. Haplotypes are scaled according to the number of times they occurred in the sample.

