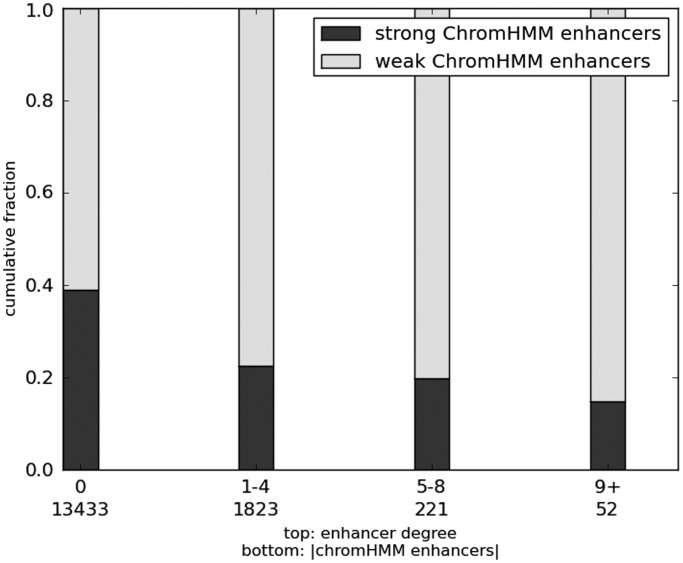
Figure 4.
Relative to strong enhancers, weak enhancers are more likely to be coordinately activated with other enhancers. Bar plot shows the relative fractions of all enhancers that are non-ambiguously classified in chromHMM data base as ‘weak’ or ‘strong’ enhancers partitioned into four groups, based on their degree, i.e. the number of other enhancers with which they are epigenetically highly correlated (FDR 0.0001), which is recorded along top row of x-axis. Numbers on bottom row indicate the total number of non-ambiguously classified chromHMM enhancers in that bin. The determination of whether an enhancer has 0 neighbors was made at a more relaxed FDR 0.05.

