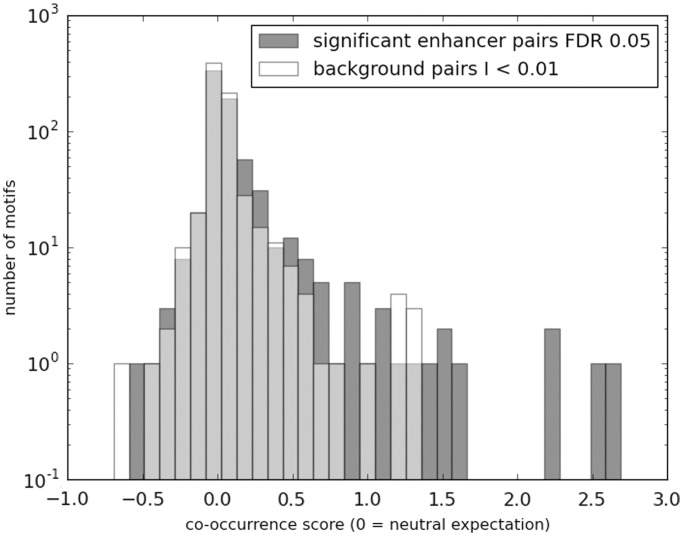
Figure 5.
Motif co-occurrence is greater among correlated enhancers relative to background non-correlated enhancer pairs. Histogram shows the log enrichment of motif co-occurrence above random expectation for significantly correlated enhancer pairs (FDR 0.01) (green) compared with the same for background pairs (red). The x-axis shows the log of enrichment values, where 0 denotes random expectation, and more positive scores indicate higher enrichment, whereas negative scores indicate higher depletion. The y-axis shows the number of motifs with the indicated level of log enrichment. Background pairs were selected based on MI scores <0.01. The ‘10−1’ on the y-axis is an artifact of the drawing tool and simply represents 0.

