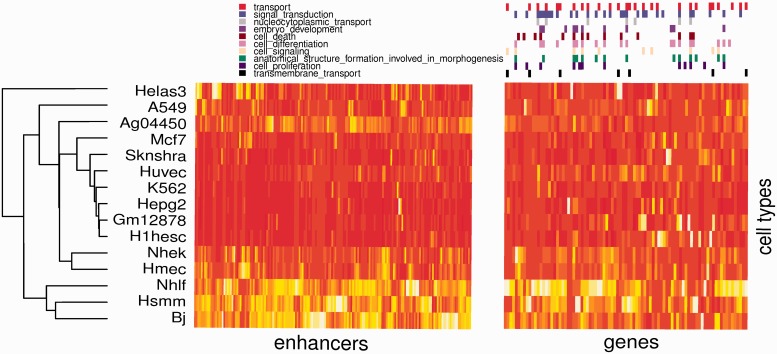
Figure 6.
Tissue activity profile of an enhancer cluster and the corresponding target genes. Left Panel: Tissue-specific DHS activity for 179 coordinately activated enhancers. Data are shown only for 15 cell types for which RNA-seq data was also available. Rows (cell types) and columns (enhancers) are hierarchically clustered. Right Panel: Corresponding expression of the 98 target genes in the same 15 cell types. Gene membership in GO slim categories that are highly enriched is displayed above the heat plot. Columns (genes) have been clustered independently, however, row order is preserved from the enhancer heatmap. In both maps, deeper shades of color indicate higher values.

