
Figure 3.
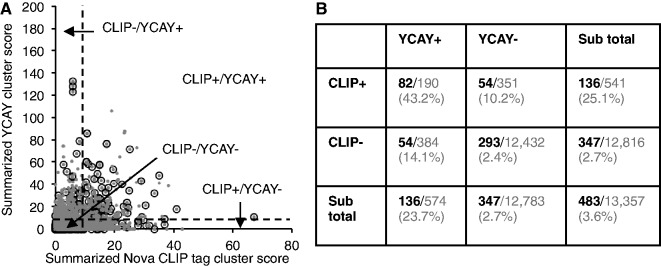
Nova-regulated alternative exons predicted from CLIP data and those predicted from YCAY clusters are complementary to each other. (A) Target exon scores predicted from CLIP data (x-axis) are plot against scores predicted from YCAY clusters (y-axis). Each gray dot is a cassette exon. All cassette exons are shown in gray, and exons with Nova-dependent splicing as determined by Affymetrix exon or exon-junction microarray data are overlaid in empty circles. A somewhat arbitrary threshold of summarized CLIP tag cluster score (10) or YCAY cluster score (10) is indicated by the dotted lines. (B) Breakdown of exons according to their summarized CLIP tag cluster score or YCAY cluster score above or below the threshold. The number (black and bold font) of exons currently with evidence of Nova-dependent splicing over the total (gray) in each category are also shown. The percentage is indicated in the parentheses.