Figure 1.
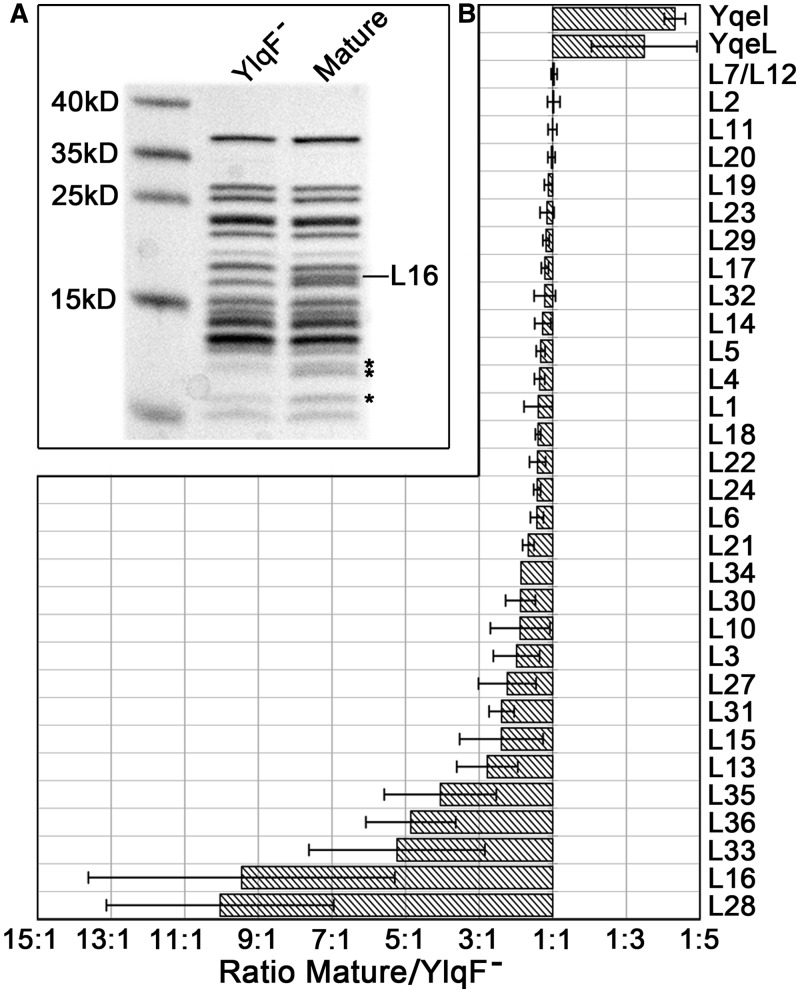
Compositional analysis of the 45S particles by QMS. (A) Protein gel analysis of the mature 50S (Mature) and premature 45S samples (YlqF−). The ribosomal protein bands that are missing or weak in the 45S sample are labeled with asterisks. (B) QMS analysis of the occupancies of the 50S proteins in the 45S sample. Standard deviations are shown by error bars.

