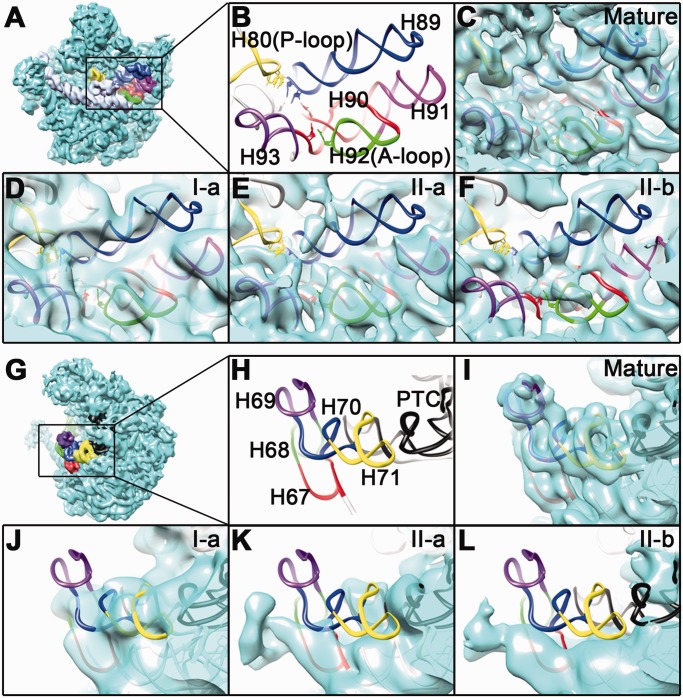
Figure 3.
Conformational variability of the PTC and H69 regions in the 45S structures. (A) Thumbnail of the mature 50S subunit viewed from the intersubunit side. (B) Close-up view of the PTC. H80, H89, H90, H91, H92 and H93 are colored yellow, blue, red, magenta, green and purple, respectively. All the maps in (C–F) are superimposed with their respective atomic models. As shown, none of the intermediate maps (I-a, II-a and II-b) display a completely resolved PTC, indicating a large flexibility at these helices. (G) Thumbnail of the mature 50S subunit viewed from the L7/L12 side. (H) Close-up view of the H69 region. H67, H68, H69, H70, H71 and the PTC are colored red, green, purple, blue, yellow and black, respectively. All the maps in (I–L) are superimposed with the atomic model of the mature 50S structure.

