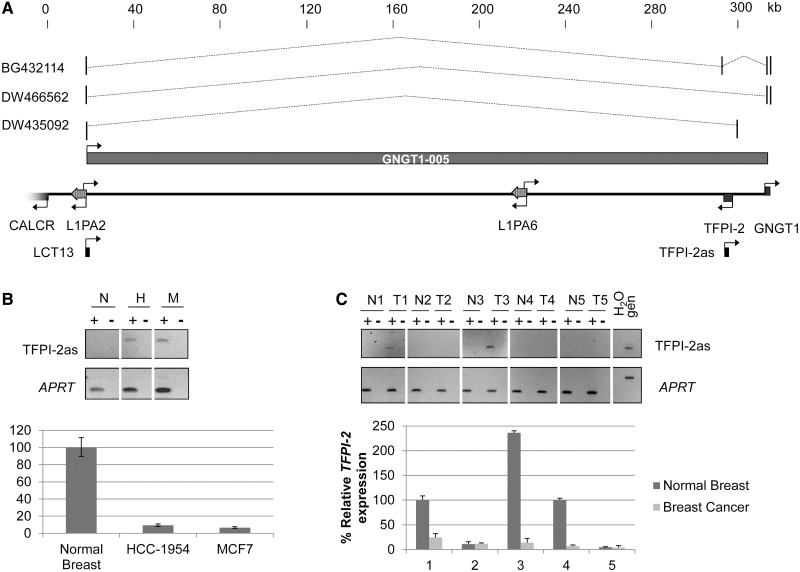
Figure 1.
Correlated expression of LCT13 and TFPI-2as transcripts in breast cancer cells. (A) Schematic diagram of a 300-kb region of chromosome 7q21.3 including LCT13 and the TFPI-2 gene. Scale is kilobase and indicates the position from the centromere with the value of 0 arbitrarily assigned to the TSS of CALCR. Genes (5′ segment of CALCR, TFPI-2 and GNGT1) are indicated as gray arrows. Two LINE-1 elements are present in the region (L1PA2 and L1PA6). Transcriptional orientations are indicated by arrows. LCT13 is a previously identified transcript shown to initiate at an L1ASP by 5′ RACE (22). TFPI-2as is the fragment analysed by strand-specific RT–PCR to test for the presence of TFPI-2 antisense RNAs. Displayed are the three spliced ESTs isolated from kidney (BG432114) and liver (DW466562 and DW435092) libraries that initiate at the LINE1 antisense promoter like LCT13 and extend past the TFPI-2 gene with a putative alternative transcript GNGT1-005 also annotated. (B) Expression of TFPI-2as (upper) and TFPI-2 (lower) in normal breast (N) and in breast cancer cell lines (H, HCC-1954; M, MCF7) analysed by strand specific and real-time RT–PCR, respectively. TFPI-2 expression is reduced in both breast cancer cell lines compared to normal controls (n = 3). TFPI-2 expression levels were normalized to HPRT. (C) Expression of TFPI-2as (upper) and TFPI-2 (lower) in a panel of five matched normal and tumour breast tissue analysed as described in B.

