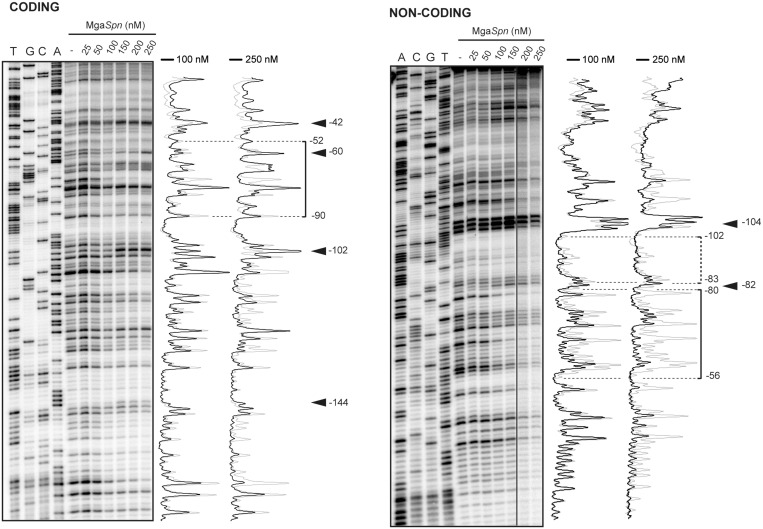
Figure 4.
DNase I footprints of complexes formed by MgaSpn on the 222-bp DNA fragment. Coding and non-coding strands relative to the P1623B promoter were 32P-labelled at the 5′end. Dideoxy-mediated chain termination sequencing reactions were run in the same gel (lanes A, C, G, T). All the lanes displayed came from the same gel. Densitometer scans corresponding to DNA without protein (grey line) and DNA with the indicated concentration of protein (black line) are shown. In this assay, the concentration of DNA was 4 nM. The regions protected at 100 nM of MgaSpn are indicated with brackets. Arrowheads indicate positions that are slightly more sensitive to DNase I cleavage. The indicated positions are relative to the transcription start site of the P1623B promoter.

