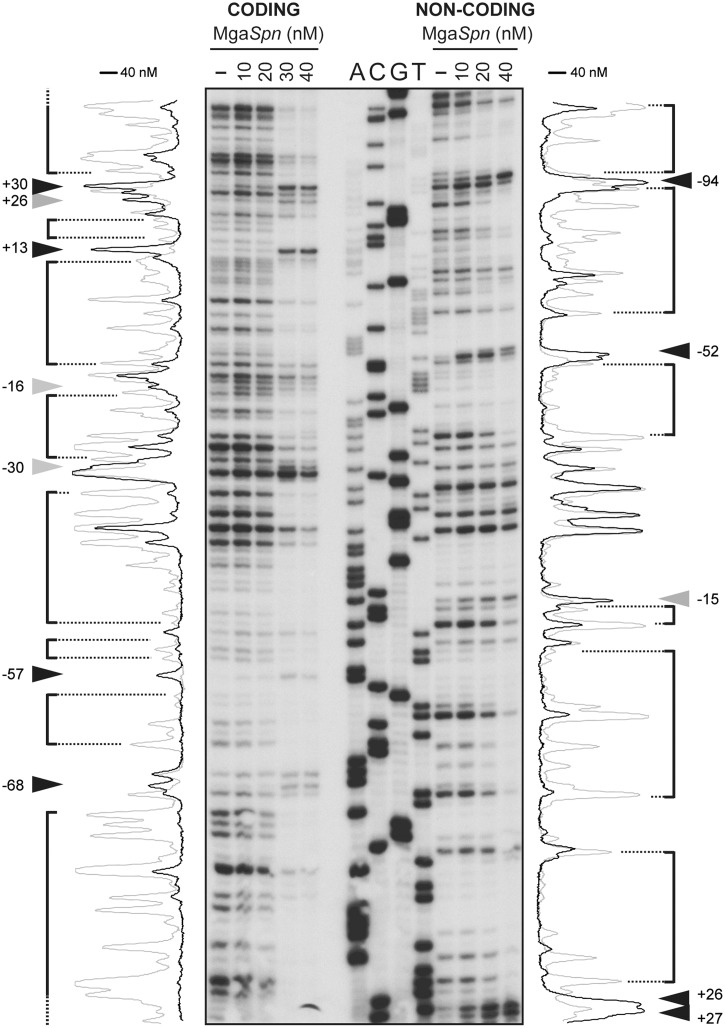
Figure 6.
DNase I footprints of complexes formed by MgaSpn on the 224-bp DNA fragment. Coding and non-coding strands relative to the Pmga promoter were 32P-labelled at the 5′end. Dideoxy-mediated chain termination sequencing reactions were run in the same gel (A, C, G, T). Densitometer scans corresponding to free DNA (grey line) and bound DNA (40 nM of MgaSpn; black line) are shown. In this assay, the concentration of DNA was 2 nM. Numbers indicate positions relative to the transcription start site of the Pmga promoter. Hypersensitive sites (arrowheads) flanking protected regions (brackets) are indicated.

