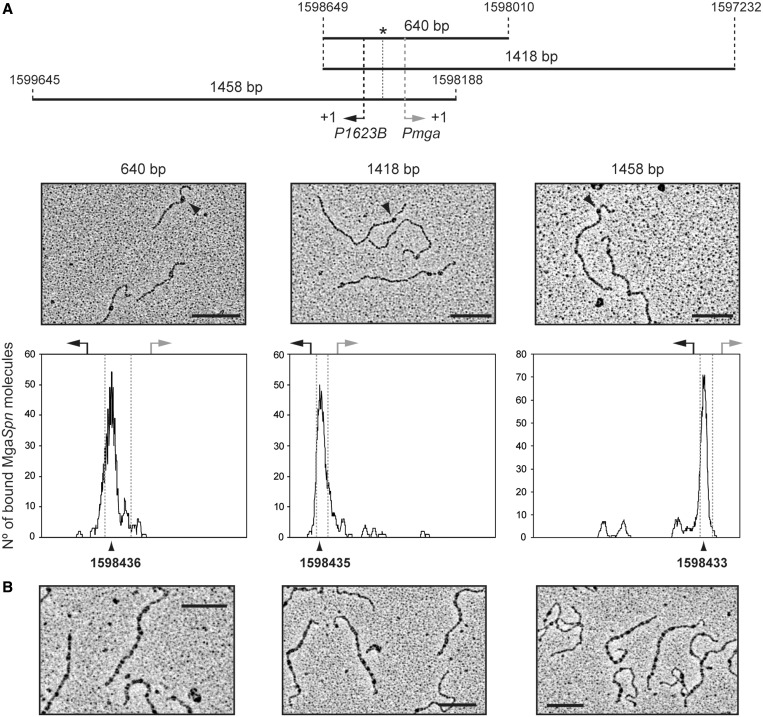
Figure 8.
Electron microscopy analysis of MgaSpn-DNA complexes. (A) MgaSpn was incubated with different DNA fragments (640, 1418 and 1458 bp) at low protein/DNA ratios to favour the formation of C1 complexes (MgaSpn bound to its primary site). The position of the PB activation region is indicated with an asterisk. Electron micrographs of the protein–DNA complexes are shown, and representative MgaSpn–DNA complexes are indicated with a black arrow. The distribution of the MgaSpn positions on the three DNA fragments is shown. Position of the transcription start site of the P1623B (black arrow) and Pmga (grey arrow) promoters is indicated. (B) MgaSpn was incubated with the 1418-bp DNA fragment at high protein/DNA ratios. Electron micrographs of DNA molecules covered by MgaSpn are shown. Scale bar, 500 bp.

