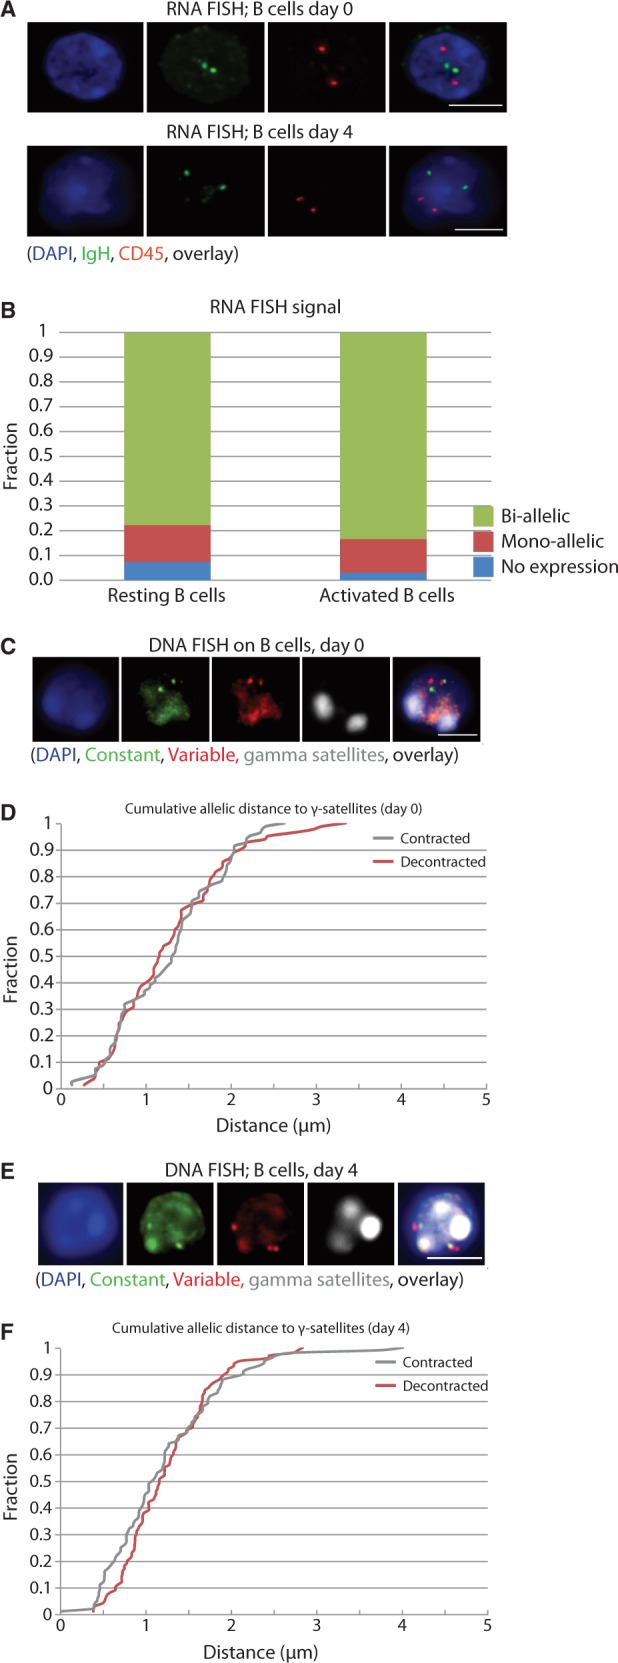
Figure 1.

Biallelic expression and comparable nuclear positioning of the two IgH loci relative to PCH in resting and activated B cells. (A) Representative picture of RNA FISH in resting (upper row) and activated B cells (lower row). (B) Quantification of the RNA FISH data plotted as the percentage of IgH signals in CD45+ cells on the Y-axis. A minimum of 50 cells were analyzed per cell type. Cells with >2 RNA signals for IgH were excluded from the analysis. (C) Representative picture of DNA FISH in resting B cells. (D) Cumulative frequency of the minimal distance of IgH signals to the γ-satelite FISH signal in resting B cells. Contraction is defined as the minimal distance between two different probes on the IgH locus. The distance of the IgH signals to γ-satelites in μm is depicted on the X-axis. (E) Representative picture of DNA FISH in activated B cells. (F) Cumulative frequency of the minimal distance of the IgH signals to the γ-satelite FISH signal in activated B cells. FISH pictures represent several Z-stacks projected on top of each other, scale bar in overlays depicts 4 µm. Images were collected using a Leica DM6000 B microscope equipped with a 100× objective, Leica DFC360 FX camera, taking z-steps of 0.2 µm. Leica application suite 2.6.0 software was used both for image collection and deconvolution.
