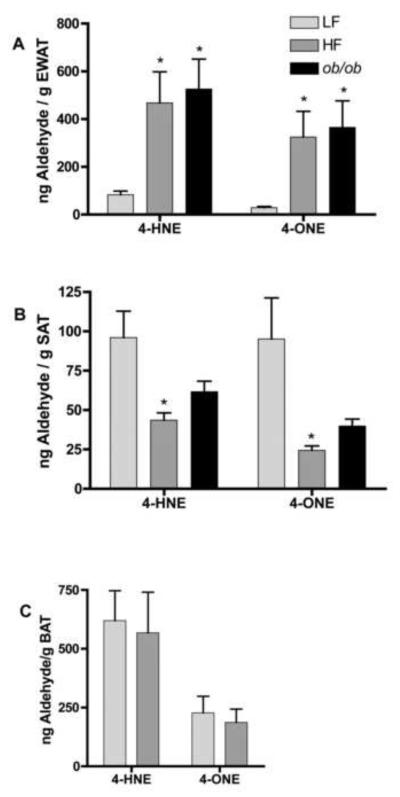
Figure 4. Adipose Tissue Levels of 4-HNE and 4-ONE.
Adipose tissue from C57Bl/6J mice fed either chow (LF) or high fat (HF) diet for 9 weeks post-weaning or ob/ob leptin deficient mice was harvested and analyzed for 4-HNE and 4-ONE levels. (A) epididymal adipose tissue (n=6 for chow fed mice, n=10 for high fat fed mice, n=6 for ob/ob mice), (B) subcutaneous adipose tissue (n=7 for chow and high fat fed mice, n=6 for ob/ob mice), (C) and brown adipose tissue (n=7 for chow and high fat fed mice). *Denotes statistically significant difference between control and experimental groups with p<0.05 as determined by an unpaired student's t-test.

