Figure 6.
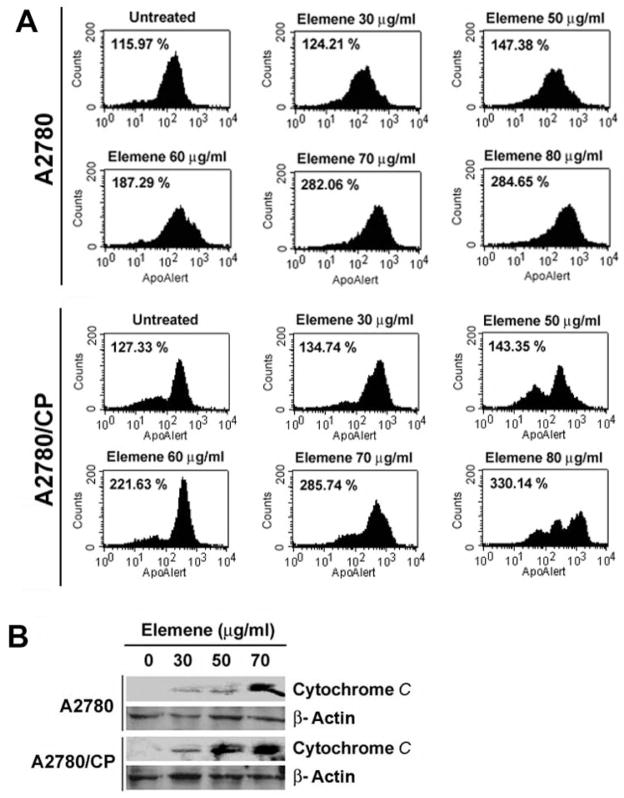
Detection of mitochondrial transmembrane potential (ΔΨm) and cytochrome c release into the cytosol in A2780 and A2780/CP cells. A: ΔΨm was assessed using the BD MitoSensor™ reagent staining. Cells were treated with β-elemene at the indicated concentrations for 48 h, harvested, incubated with the BD MitoSensor™ reagent (final concentration, 5 μg/ml) at 37°C in an incubator with 5% CO2 for 20 min, and then rinsed in suspension. Apoptotic cells were detected by flow cytometry as described in the Materials and Methods. The geometric mean fluorescence of the cells was calculated. A higher value reflects a lower ΔΨm and more apoptosis. The geometric means are shown in each panel. Untreated cells were used as controls. B: Release of cytochrome c from mitochondria into the cytosol in A2780 and A2780/CP ovarian cancer cells was detected by western blots.

