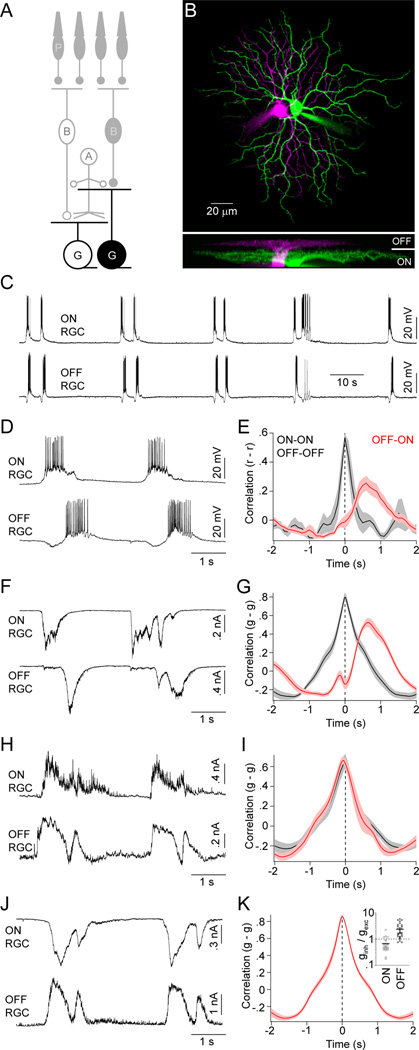
Figure 1. Spike and synaptic input patterns of ON and OFF RGCs during stage III waves.
(A) Schematic illustration of the retinal circuitry. Letters denote the following cell classes: P -photoreceptors, B - CBCs, A - ACs, G - RGCs. Light responses are indicated by filled (OFF) or open (ON) somata. Cells recorded to obtain the data of this figure are highlighted. (B) Orthogonal projections of a 2-photon image stack of representative ON (green) and OFF (magenta) RGCs recorded in a flat-mounted P12 retina. (C, D) Representative current-clamp (I = 0 pA) traces of neighboring ON and OFF RGCs shown on different timescales. (E) Crosscorrelations of the firing rates (r) of same (black) and opposite (red) sign RGCs during stage III waves. Lines (shaded areas) here and elsewhere represent the means (± SEMs) of the respective populations (n = 4 for same sign and n = 11 for opposite sign RGCs). (F) Representative EPSCs (VM ~ −60 mV) of neighboring ON and OFF RGCs during glutamatergic waves. (G) Crosscorrelations of excitatory conductances (g) of same (n = 10) and opposite sign (n = 10) RGCs. (H) Representative IPSCs (VM ~ 0 mV) of neighboring ON and OFF RGCs. (I) Crosscorrelations of inhibitory conductances (g) of same (n = 7) and opposite (n = 7) sign RGCs color-coded as in (E) and (G). (I) Simultaneously recorded EPSCs and IPSCs from a representative ON and OFF RGCs. (K) Crosscorrelation (n = 8) of excitatory conductances of ON RGCs and inhibitory conductances of OFF RGCs. The ratios of inhibitory (ginh) and excitatory (gexc) conductances of ON (open circles) and OFF (filled circles) RGCs during stage III waves are shown in an inset. Lines indicate the means of the respective populations. See also Figure S1.

