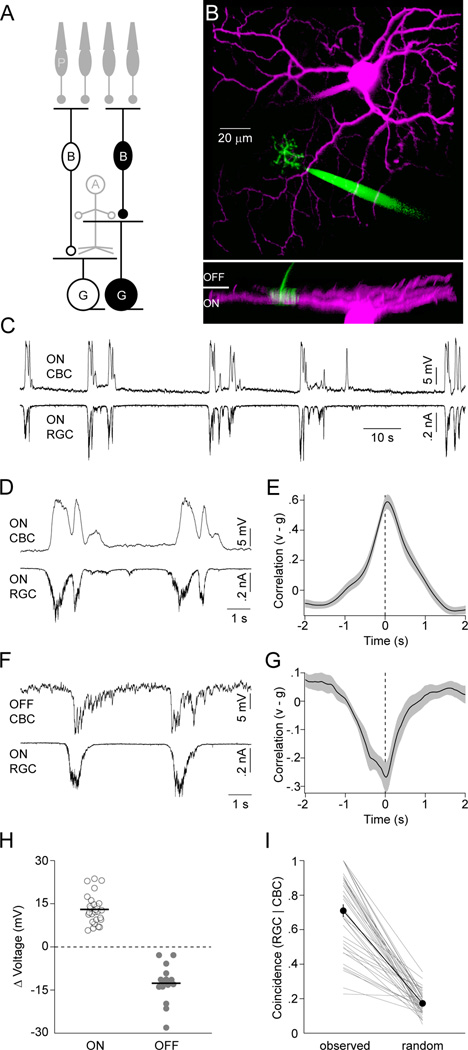
Figure 2. ON CBCs depolarize and OFF CBCs hyperpolarize during stage III waves.
(A) Schematic of the retinal circuitry with the cells recorded to obtain data presented in this figure highlighted. Labeling as in Figure 1. (B) Representative 2-photon image stack projected along two orthogonal axes. For visual clarity, the recording electrodes have been digitally removed from the side view (bottom panel). (C, D) Simultaneous voltage (I = 0 pA, VRest ~ −63 mV) and EPSC (VM ~ −60 mV) recording of an ON CBC and ON RGC, respectively, during stage III waves, shown on different timescales. (E) Crosscorrelation (mean ± SEM, n = 18) of ON CBC voltage (v) and excitatory synaptic conductance of ON RGCs (or inhibitory conductance of OFF RGC) (g). (F) Simultaneous voltage and EPSC recording of an OFF CBC (VRest ~ −46 mV) and ON RGC. (G) Crosscorrelation (n = 10) of OFF CBC voltage (v) and excitatory conductance of ON RGCs (or inhibitory conductance of OFF RGC) (g). (H) The average of the maximal voltage changes during each wave of a given CBC is indicated by circles (open - ON, filled - OFF). Population averages are shown by lines. (I) The conditional probability of algorithmically detecting a wave in an ON RGC EPSC trace given that a wave was identified in the simultaneously recorded CBC voltage is depicted. Thin lines indicate data from each dual recording. The thick line and filled symbols (errorbars) represent the mean (± SEM) of the population. See also Figure S2.

