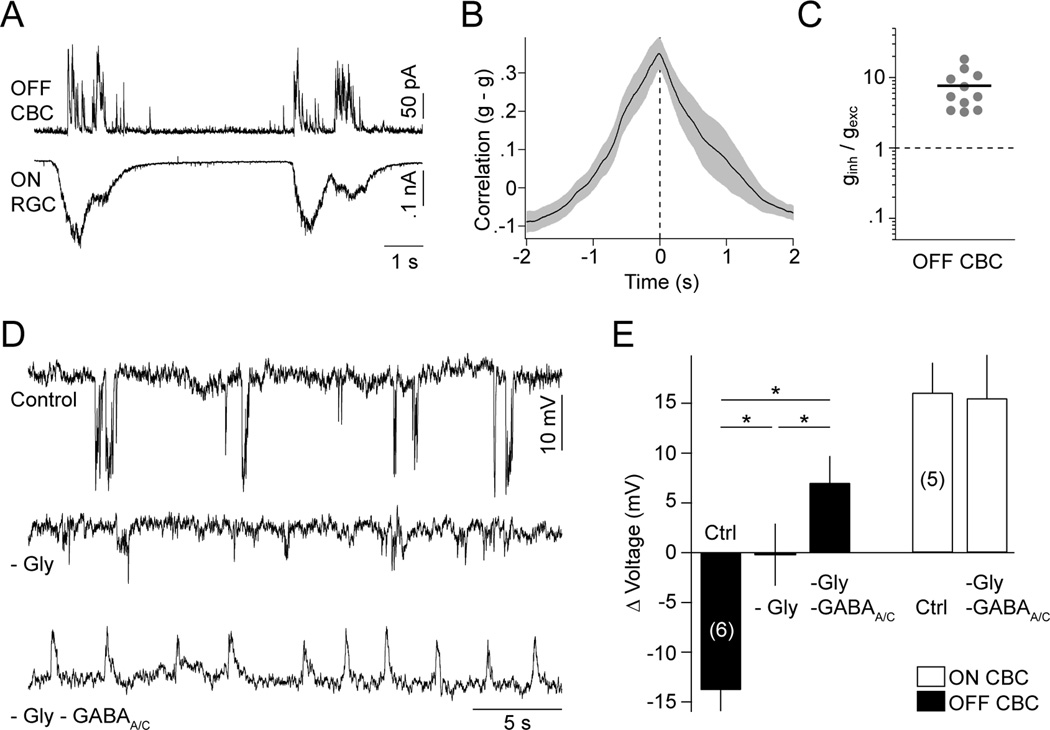
Figure 3. Glycinergic and GABAergic crossover inhibition hyperpolarizes OFF CBCs during each wave.
(A) Simultaneous recording of wave-associated IPSCs (VM ~ 0 mV) in OFF CBCs and EPSCs (VM ~ −60 mV) in ON RGCs. (B) Crosscorrelation (mean ± SEM, n = 7) of inhibitory synaptic conductances of OFF CBCs and excitatory synaptic conductances of ON RGCs. (C) Ratio of inhibitory (ginh) and excitatory (gexc) synaptic conductances activated in OFF CBCs (filled circles) during stage III waves. Line indicates mean of the population. (D) Voltage traces of OFF CBCs in control conditions (top trace), in the presence of strychnine (500 nM, middle trace), and strychnine (500 nM), gabazine (5 µM) and TPMPA (50 µM) (bottom trace). (E) Group data (mean ± SEM) for ON (white bars) and OFF (black bars) CBCs illustrating the cell-type-specific effects of inhibitory blockers on stage III voltage responses. See also Figures S3 and S4.

