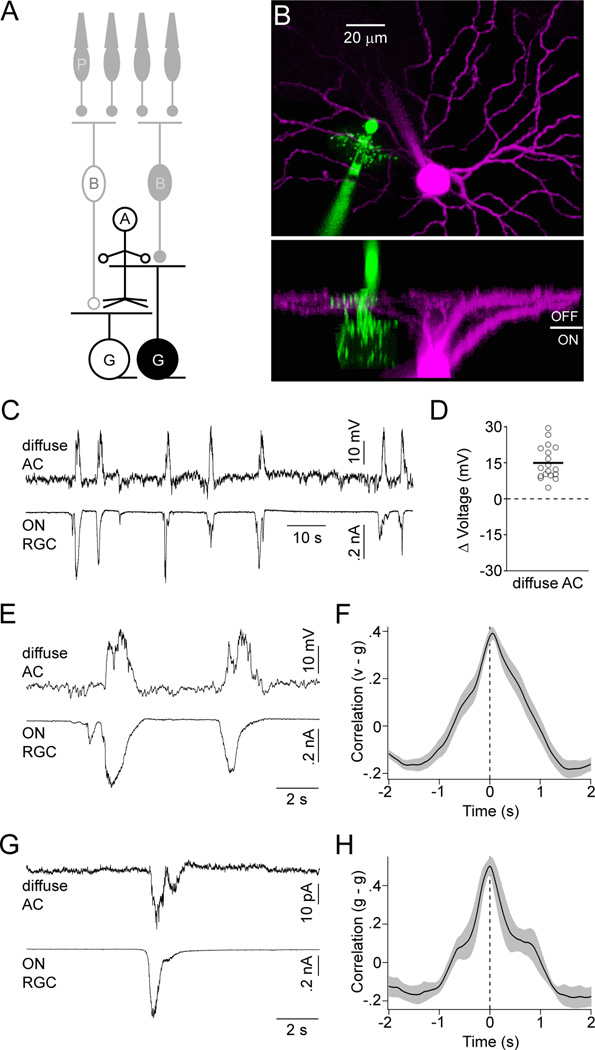
Figure 4. Diffuse ACs receive excitatory input and depolarize during the ON phase of stage III waves.
(A) Circuit diagram of the retina in which neurons recorded for this figure are highlighted; labeling as in Figure 1. (B) Orthogonal projections of a 2-photon image stack of a diffuse AC (green) and OFF RGC (magenta) filled during a recording. (C) Simultaneous current- (I = 0 pA, VRest ~ −46 mV) and voltage-clamp clamp (EPSCs, VM ~ −60 mV) recording from a diffuse AC and ON RGC, respectively. (D) The mean maximal voltage change during waves for each diffuse AC is indicated by open circles. A solid line shows the mean of all diffuse ACs (n = 18) analyzed. (E) Excerpts of the traces in (C) on an expanded timescale. (F) Crosscorrelation (mean ± SEM, n = 9) of the membrane potential (v) of diffuse ACs with excitatory conductances in ON RGCs (or inhibitory conductances in OFF RGCs) (g). (G) Simultaneous recording of EPSCs in a diffuse AC and an ON RGC. (H) Crosscorrelation (mean ± SEM, n = 5) of excitatory conductances in diffuse ACs (g) with excitatory conductances in ON RGCs (or inhibitory conductances in OFF RGCs) (g).

