
Figure 7.
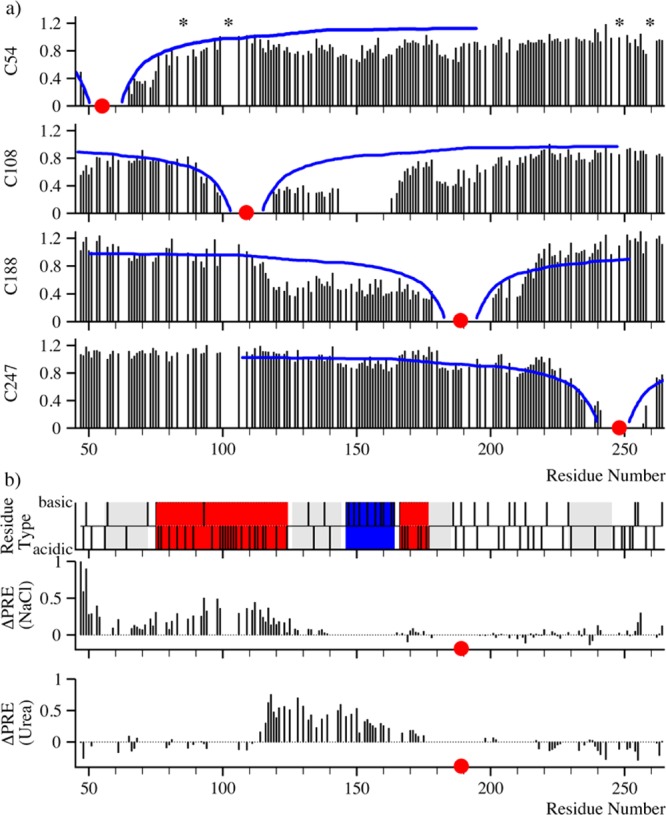
(a) PRE data for the four single mutants C54, C108, C188, and C247. Superimposed in blue are PREs calculated for random coils with a Flory characteristic ratio of 2 by the Solomon–Bloembergen relation.23 The red dots mark the different labeling sites. The asterisks mark stretches comprising larger numbers of unassigned resonances. (b) Charge map of OPN (top; blue corresponds to patches of primarily basic residues, red to patches of acidic residues, and gray to primarily hydrophobic patches) and PRE changes (ΔPRE) for high-salt (center) and high-urea (bottom) conditions obtained for the C188 mutant [ΔPRE = 15N–1H HSQC intensity (high urea and salt) – 15N–1H HSQC intensity (no urea or salt)].