
Figure 8.
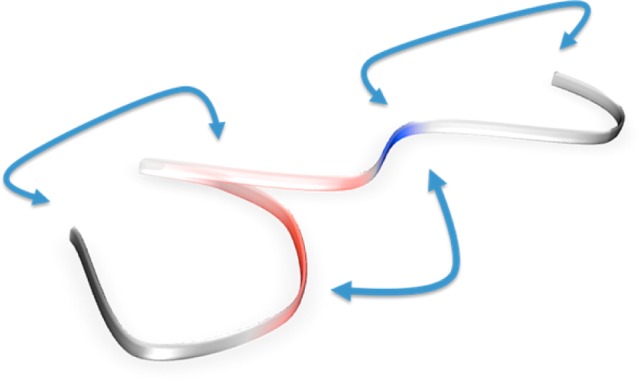
Sketch of the assumed “average” structure of OPN based on the PRE data. The arrows indicate significant PRE effects. As such, OPN can be pictured as having a more compact core and back-folded termini. The colors refer to the charge map in Figure 7b (blue corresponds to patches of primarily basic residues, red to patches of acidic residues, and gray to primarily hydrophobic patches).