Figure 5.

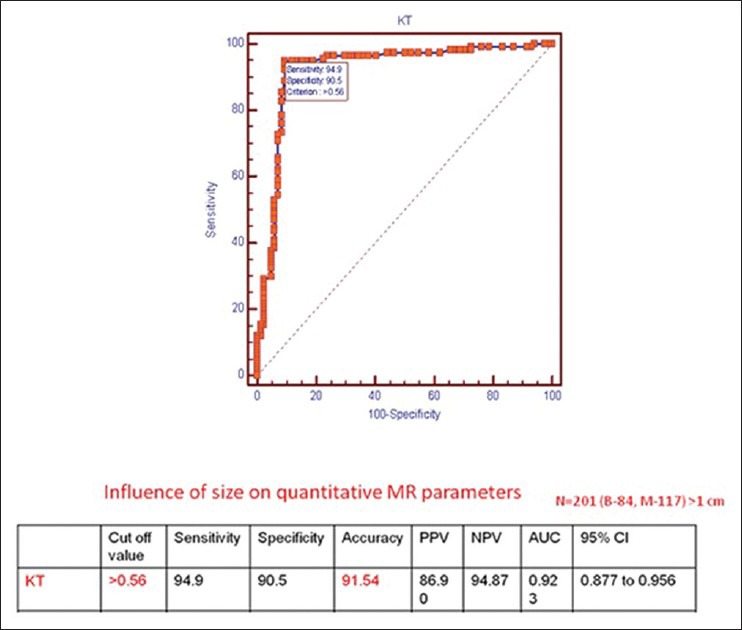
Results of statistical analysis and ROC curve for Ktrans for lesions >1 cm in size with a cut-off value of 0.56/min (n = 201)

Results of statistical analysis and ROC curve for Ktrans for lesions >1 cm in size with a cut-off value of 0.56/min (n = 201)