
Figure 13.
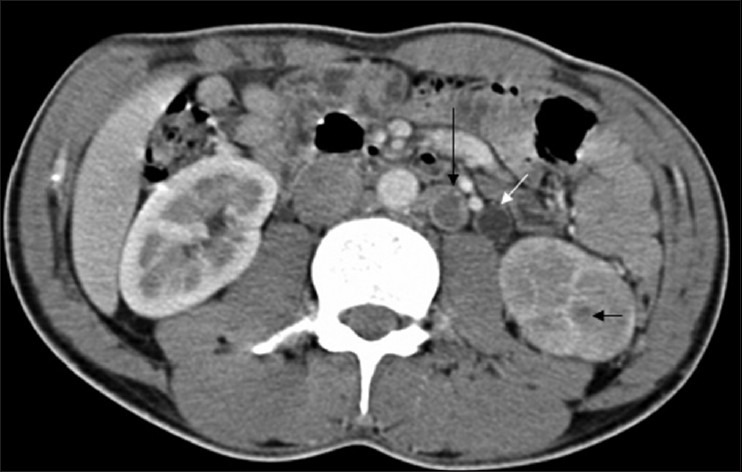
CT revealing poor density (L) nephrogram with complete loss of corticomedullary differentiation. Tiny granulomas (short black arrow) are noted and so are necrotic left para-aortic lymph nodes (long black arrow) and a dilated ureter with urothelial thickening (white arrow)