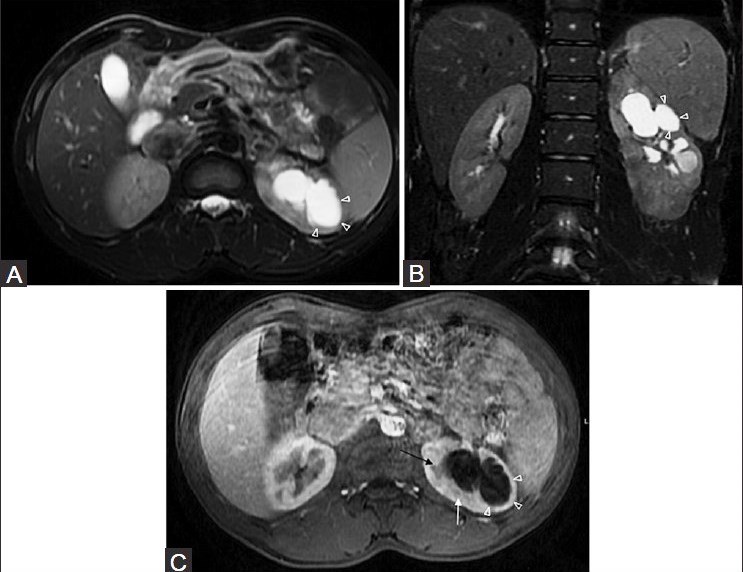
Figure 19 (A-C).

(A) axial and (B) coronal fat-saturated T2W FSE sequence and (C) post-contrast axial T1 fat-saturated MRI images-showing a TB cavity (arrowheads) communicating with dilated calyces. Note small peripheral non-enhancing hypointense lesion, suggestive of a granuloma (white arrow). An enlarged pyramid is also noted (black arrow)
