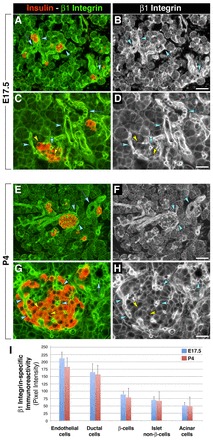
Fig. 1.

Expression pattern of β1 integrin in the developing and postnatal mouse pancreas. (A-H) Immunolocalization of β1 integrin and insulin in E17.5 (A-D) and P4 (E-H) pancreas. (B,D,F,H) Monochromatic images to better visualize cell-cell and cell-matrix boundaries immunostained for β1 integrin. The brightest β1 integrin-specific immunoreactivity is detected in ductal cells (cyan arrows) and in endothelial cells (cyan arrowheads). Significant β1 integrin expression is also detected at cell-cell and cell-matrix boundaries of developing β-cells (yellow arrowheads). (I) Quantitative assessment of the pixel intensity of β1 integrin-specific immunoreactivity in E17.5 and P4 pancreas. Values are presented as mean±s.e.m. Scale bars: 50 μm in B,F; 25 μm in D,H.
