
Fig. 3.
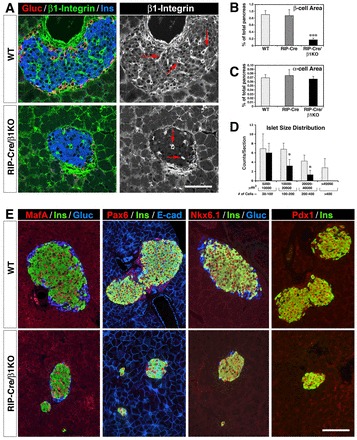
Characterization of β1 integrin-deficient pancreatic islets. (A) Representative confocal images of pancreatic sections from 8-week-old WT (top row) and RIP-Cre/β1KO mice (bottom row) immunostained for β1 integrin (green), glucagon (red) and insulin (blue). Red arrows in monochromatic images point to intra-islet endothelial cells strongly immunoreactive for β1 integrin. (B,C) Quantification of insulin-positive (B) and glucagon-positive (C) area in WT (n=5), RIP-Cre (n=3) and RIP-Cre/β1KO (n=5) pancreas. Values are expressed as a percentage of total pancreatic area ± s.d. ***P<0.001. (D) Islet cell number and size distribution in WT and RIP-Cre/β1KO mice. Values are expressed as mean ± s.d. of the number of islets per section (n=3 animals). *P<0.05. (E) Immunolocalization of transcription factors MAFA, PAX6, NKX6.1 and PDX1 in WT and RIP-Cre/β1KO pancreas. Scale bars: 50 μm in A; 70 μm in E.