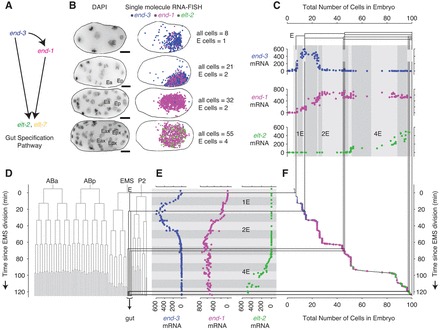
Fig. 1.

Gene expression dynamics in early gut specification, as determined by single-molecule RNA FISH. (A) A portion of the gene network responsible for specifying the gut. (B) Images of fixed N2 (’wild type’) strain C. elegans embryos grown at 20°C. Scale bars: 10 μm. Left column: maximum merges of DAPI nuclear staining fluorescence images. ‘E’ indicates E cells (as determined by shape, location and gut gene expression). Right column: location of individual transcripts of end-3, end-1 and elt-2 (blue, magenta and green, respectively) obtained from single-molecule RNA FISH staining and subsequent image processing. Filtered RNA FISH fluorescence images are shown in supplementary material Fig. S1. (C) Gene expression trajectories for a sample of N2 embryos grown at 20°C. The total number of end-3, end-1 and elt-2 mRNA in each embryo is plotted against the total number of cells. In C,E, thin black lines correspond to divisions in the E lineage and shaded blocks in the backgrounds correspond to 10 minutes of developmental time. (D) Embryonic lineage of N2 C. elegans based on data from Bao et al. (Bao et al., 2008). The division times were scaled to match the average 20°C division rate observed by Sulston et al. (Sulston et al., 1983). (E) mRNA counts in each embryo as in C but plotted against the estimated age at which the embryos were fixed. (F) Embryo age versus total number of cells in the embryo. The data points from C and E are overlaid with symbol area proportional to the mRNA level.
