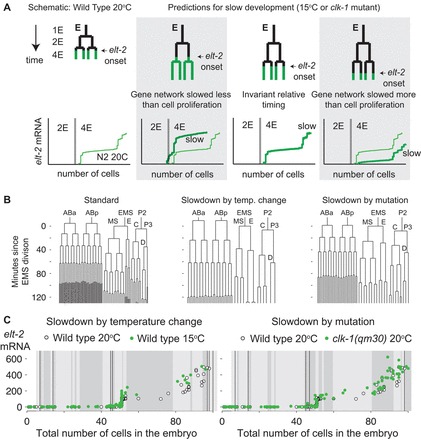
Fig. 2.

Experimental strategy to study the relative timing of cell proliferation and gene expression. (A) Cell proliferation and the gene expression network can be slowed down by different factors under conditions of overall metabolic slowdown. This will be observable as a difference in the RNA versus total embryo cell count trajectories compared with standard (N2 20°C) development. If gene expression and proliferation are synchronized, the trajectories will be similar. (B) From left to right: wild-type embryonic lineage grown at 20°C (as in Fig. 1D), cell lineage of a representative wild-type embryo grown at 15°C, and cell lineage of a clk-1(qm30) mutant embryo grown at 20°C with a strong slowdown phenotype (embryo 6 from supplementary material Fig. S3). (C) Green circles: gene expression trajectories of elt-2 plotted against total number of cells in embryos of wild-type C. elegans grown at 15°C (left) or clk-1(qm30) mutant worms grown at 20°C (right). White circles: data from N2 worms grown at 20°C (Fig. 1). Thin black vertical lines correspond to divisions in the E lineage and shaded blocks in the backgrounds correspond to 10 minutes of developmental time. For clk-1(qm30), the lineage data are from the same embryo as in B. For 15°C data, we scaled the N2 20°C lineage by a factor of 1.77, consistent with the smallest slowdown observed in any of the embryos we lineaged. The data agree with the ‘invariant timing’ scenario.
