Fig. 3.

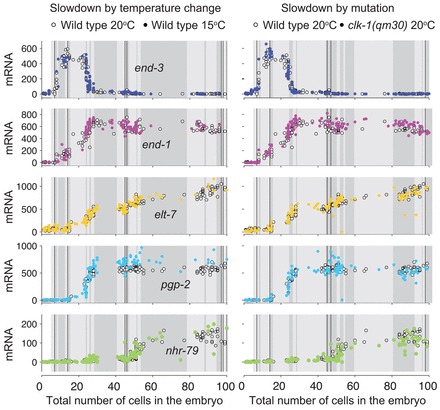
Expression and proliferation are synchronized in the gut specification pathway. Total embryo transcript number versus total cell count trajectories for gut-specific genes end-1, end-3, pgp-2, elt-7 and nhr-79. White symbols are for N2 worms grown at 20°C; colored circles correspond to N2 embryos grown at 15°C (left panels) or clk-1(qm30) embryos grown at 20°C (right panels). Thin black vertical lines correspond to divisions in the E lineage and shaded blocks in the backgrounds correspond to 10 minutes of developmental time. These data agree with the ‘invariant timing’ scenario from Fig. 2.
