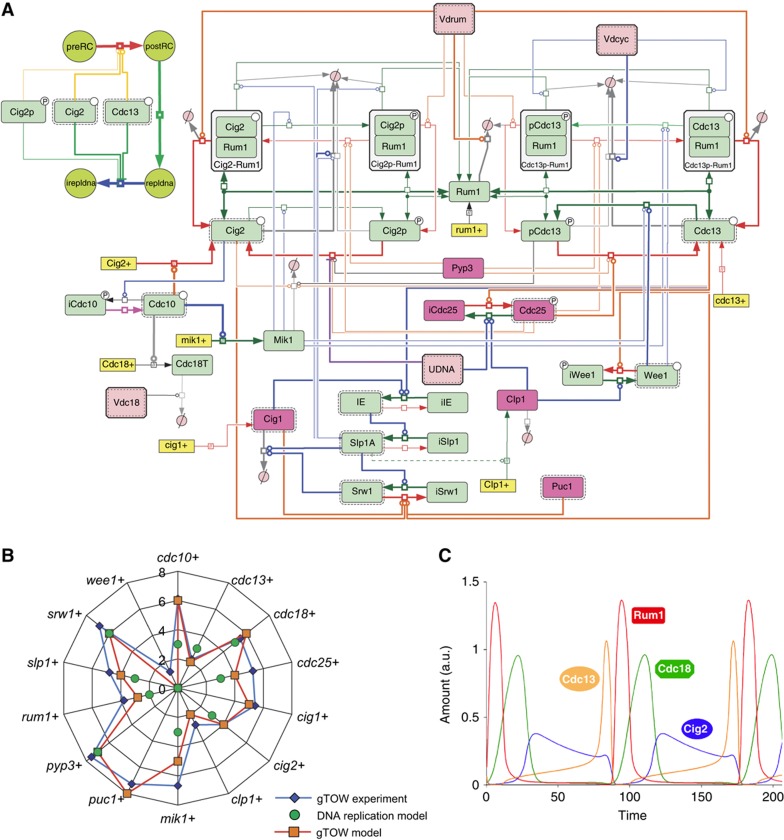
Figure 7.
Mathematical model reproducing gTOW data. (A) Whole structure of the mathematical model of the fission yeast cell cycle developed in this study (gTOW model) given with Systems Biology Graphical Notation (SBGN) using CellDesigner 4.1. Pink colored components are the ones added to the ‘basic model’ to make the ‘gTOW model’. CellDesigner file and Systems Biology Markup Language (SBML) file are provided in Supplementary information. (B) Comparison of the copy number limits of cell-cycle regulators between the data obtained by gTOW and prediction of the mathematical model. Scale of the axis=log2. (C) Time-course simulation result of the gTOW model.

