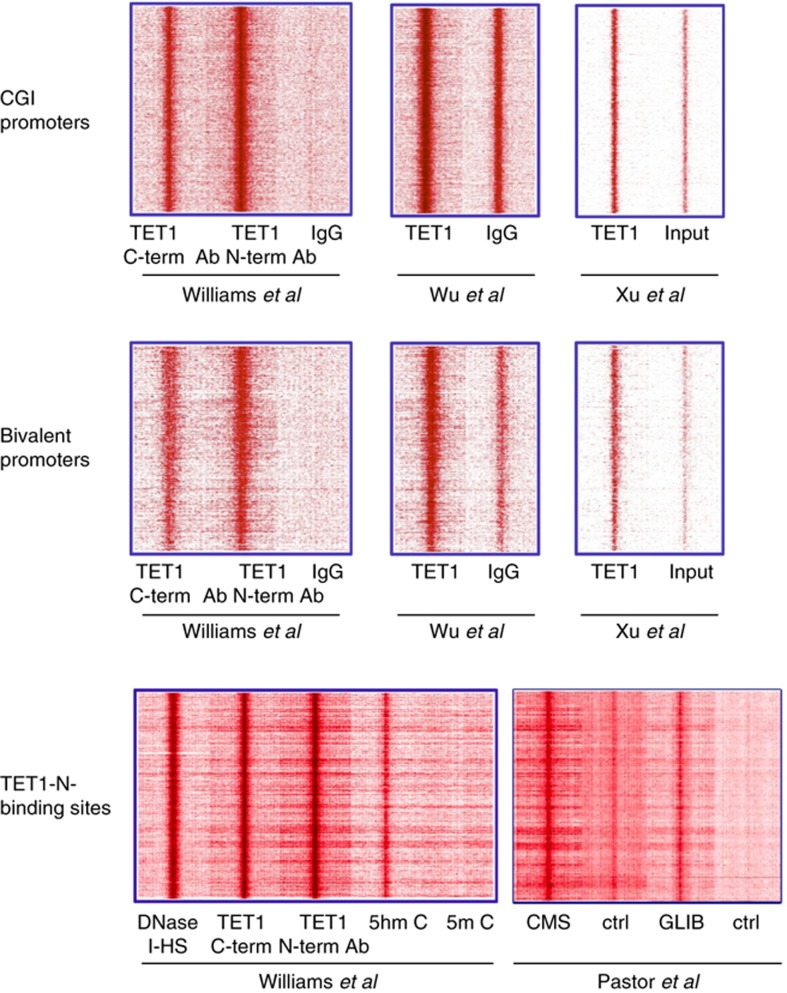
Figure 1.
Heatmap representation of TET1 enrichment in CGI promoters (top panel) and bivalent promoters (middle panel). Heatmap representation of TET1 DnaseI-HS (ENCODE-ZhBTc4 cell line), hmC, and mC enrichment in TET1-N-binding sites (bottom panel). All the heatmaps are from +5 to −5 kb flanking TSSs of CGI, bivalent promoters or TET1-N centered binding sites, reads were summed in 100 bp sliding windows. Datasets used in the analysis are indicated.

