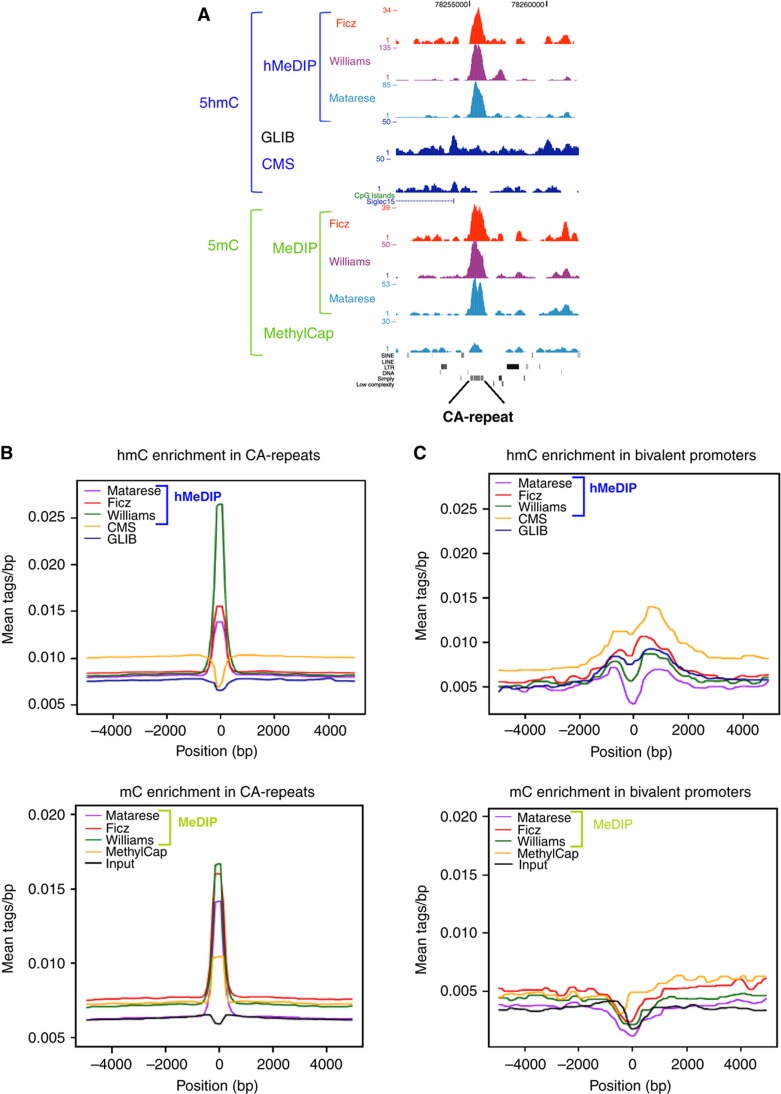
Figure 4.
5hmC and 5mC distributions at CA simple repeats and bivalent promoters. (A) Genome browser view of a CA simple repeat element with read distributions for 5hmC and 5mC using datasets as indicated. (B) 5hmC and 5mC distributions at CA simple repeats and in (C) bivalent promoters. All the distribution plots are from +5 to −5 kb flanking CA simple repeats centered (B) or TSSs bivalent promoters (C), reads were summed in 100 bp sliding windows.

