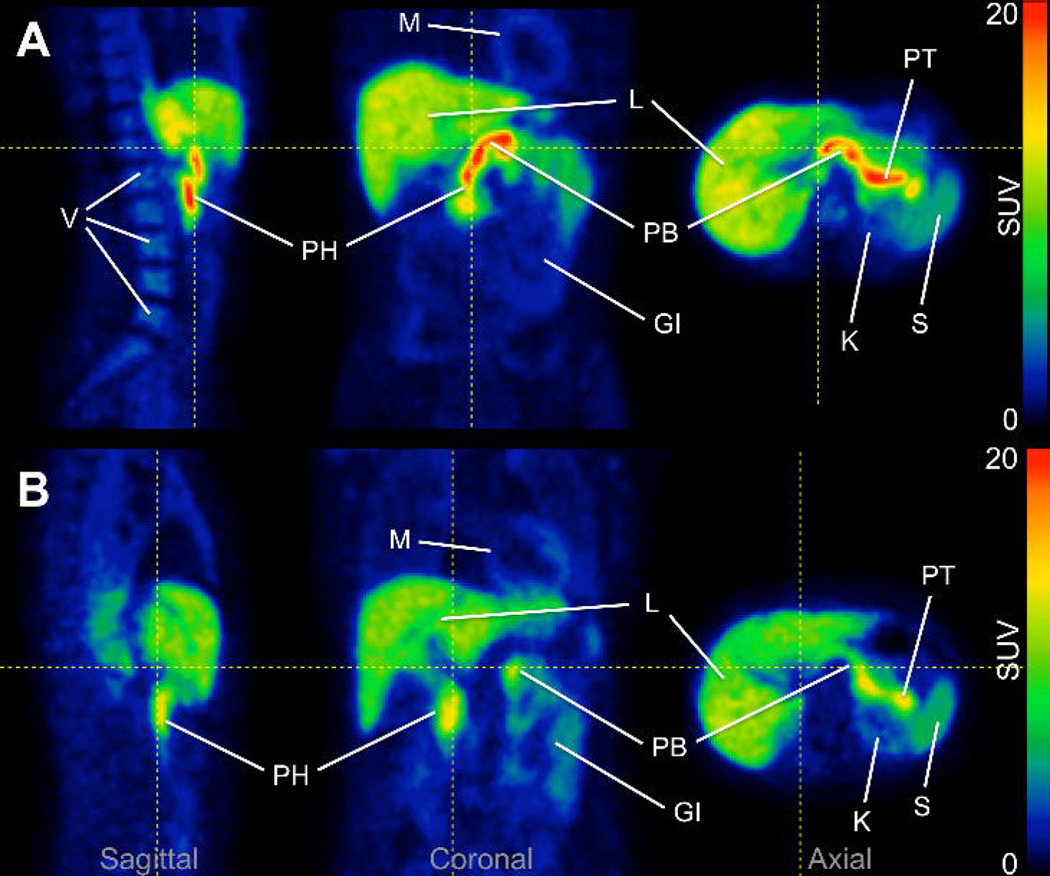
Figure 3.
Representative [18F]FP-(+)-DTBZ PET images. (A) Image acquired in a healthy control subject showed high uptake of tracer in pancreas. (B) Pancreas uptake was reduced in a type 1 diabetes patient. Both images represent PET data summed from 0 to 90 min post-injection and are displayed on a common scale (0 to 20 SUV, i.e., radioactivity normalized by injected dose and body weight). PT: pancreas tail, PB: pancreas body, PH: pancreas head, L: liver, K: kidney, S: spleen, M: myocardium, V: vertebrae, GI: gastrointestinal tract. Images for entire cohort are displayed in Supplemental Figure 2. Maximum intensity projection animations are shown in the Supplemental Videos 1–16.

