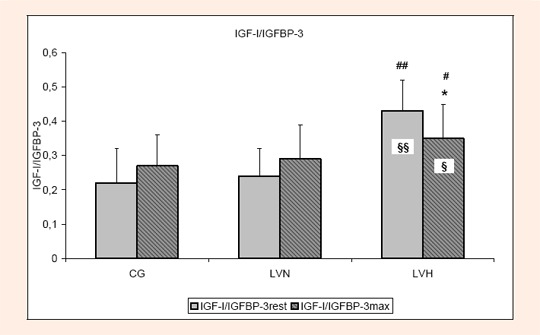
Figure 4.

Insulin Growth Factor-I to Insulin Growth Factor Binding Protein-3 ratio (IGF-I/ IGFBP-3) before (rest) and at maximal intensity of exercise (max) in control group (CG), athletes with normal heart dimension (LVN), and athletes with heart hypertrophy (LVH) (mean ± SD). * p < 0.05 rest vs. max; # and ## indicates p < 0.05 and 0.01 respectively LVH vs. CG; § and §§ indicate p < 0.05 and 0.01 respectively LVH vs. LVN.
