
Figure 3.
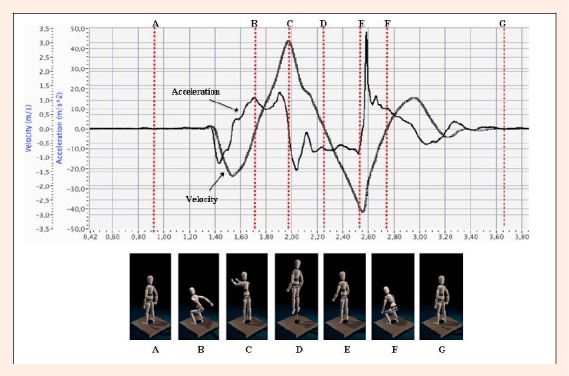
Representative example of a subject’s acceleration and velocity-time curve registered by the Keimove™ system. Red lines and schematic body images indicate important jump moments (A-G: jump, B: the body center of mass is at its lowest point; C: end of takeoff phase; D: highest point during flight phase; E: start landing phase (toes touch the ground); F: lowest position of the body center of mass during landing).