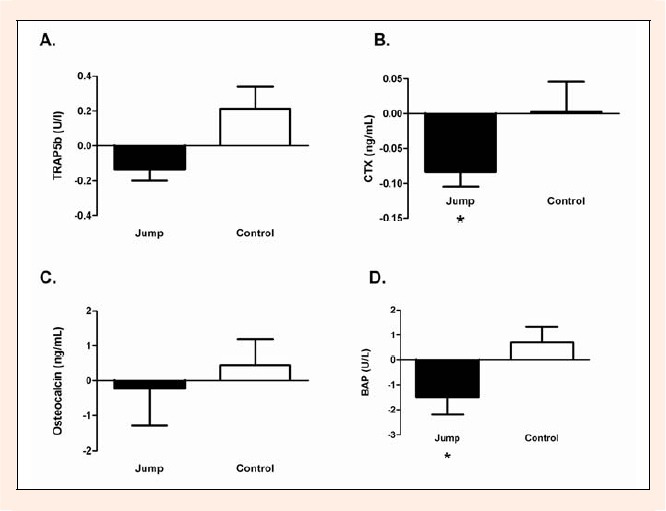
Figure 3.

Differences (Post-Pre) in Bone Serum Marker Concentrations within the jump group and control group. Paired t-test were used to determine changes from pre to post within groups. A. Serum Trap5b levels (U/I) B. Serum CTX levels (ng·mL-1) C. Serum Osteocalcin levels (ng·mL-1) D. Serum BAP levels (U/L) Means ± SEM * Significant difference (p < 0.05).
