
Figure 2.
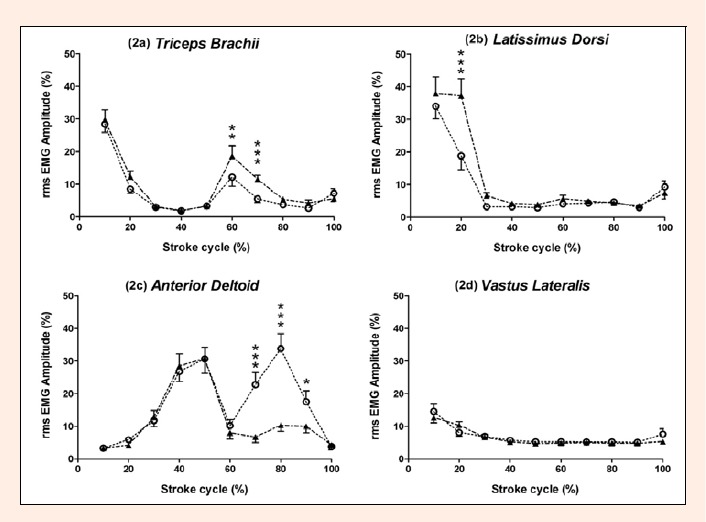
Group mean ± SEM (n=10) EMG profiles for on-ergometer (open circles) and on-water kayaking (closed triangles) stroke cycles. Each point represents the mean rmsEMG amplitude for 10% of the stroke cycle normalised to maximal rmsEMG amplitude recorded during isometric MVC. Asterisk infer difference between conditions at specific 10% intervals within stroke cycle (* inferring p < 0.05, ** inferring p < 0.01, *** inferring p < 0.001).