Abstract
The purpose of the study was to evaluate the developmental changes in performance in a repeated-sprint ability (RSA) test in young soccer players of contrasting maturity status. A total of 83 regional level Portuguese youth soccer players, aged 11-13 years at baseline was assessed annually. Stature, body mass, 7x34.2-m sprint protocol (25-s active recovery), 20-m multi-stage continuous shuttle endurance run and counter-movement jump (CMJ) without the use of the arms were measured. Fat-free mass (FFM) was determined by age and gender-specific formulas. Developmental changes in total sprint time across ages were predicted using multilevel modeling. Corresponding measurements were performed on an independent cross-sectional subsample of 52 youth soccer players 11-17 years to evaluate the predictive model. CA, CA2, maturational status (SA-CA), body size (mass and stature), FFM, aerobic endurance, lower limb explosive strength and annual volume training significantly improved the statistical fit of the RSA multilevel model. In ‘late’ maturing athletes, the best model for predicting change in RSA was expressed by the following equation: 86.54 - 2.87 x CA + 0.05 x CA2 - 0.25 x FFM + 0.15 x body mass + 0.05 x stature - 0.05 x aerobic endurance - 0.09 x lower limb explosive strength - 0.01 x annual volume training. The best fitting models for players who were ‘on time’ and ‘early’ maturing were identical to the best model for late maturing players, less 0.64 seconds and 1.74 seconds, respectively. Multilevel modeling provided performance curves that permitted the prediction of individual RSA performance across adolescent years in regional level soccer players.
Key points.
Repeated-sprint ability tests are a valuable sport-specific field test of sprint performance in youth soccer players. Here, the test had reasonable reliability and can be useful to trainers and coaches in the assessment of young athletes and in monitoring changes over time.
The total sprint time of youth soccer players advanced in biological maturation improves more, on average, than that of players who are on time (average) and late in maturation. The performance difference between early and late maturing players is consistent after about 13 years of age.
Multilevel modeling is a promising statistical technique for analyzing the development of functional capacity in a sport. It has the potential to provide useful information to assist trainers and coaches in evaluating and facilitating the development of individual players.
Key words: young athletes, multilevel modeling, growth, maturation, short-term effort
Introduction
Athletes competing in team sports are frequently required to perform short-duration sprint-type actions (≤ 10 seconds) interspersed with brief recoveries (usually ≤ 60 seconds). The capacity to perform this exercise is labeled repeated-sprint ability or RSA (Bishop et al., 2011; Buchheit et al., 2010a, 2010b; Girard et al., 2011). RSA is a functional attribute that is dependent upon metabolic (oxidative capacity, phosphocreatine recovery, H+ buffering) and neuromuscular (muscle activation, recruitment) factors (Bishop et al., 2011; Glaister, 2005; Spencer et al., 2005). Traditionally, soccer has been viewed as a sport that demands a high level of aerobic capacity (Meckel et al., 2009) but the ability to perform short bursts of intensive activity (sprints) interspersed with less intense episodes is important (Rampinini et al., 2007). More recently, however, a number of studies using time-motion analyses have questioned the relative importance of high-intensity activities to team performance in professional (Carling et al., 2012) and international youth soccer (Buchheit et al., 2010b) players. The extent to which findings in these studies can be generalized to other athletic groups or if they only represent play in certain teams and/or Leagues requires investigation. A related issue is how inter-individual differences in growth and maturation, especially apparent in early- and mid-adolescence, potentially affect RSA performance in youth soccer players.
Evidence drawn from longitudinal studies of youth soccer players suggests that maximal gains in running speed, agility, aerobic endurance and lower limb explosive strength occur, on average, close to the time of peak height velocity (i.e., the period of maximal height gain during the adolescent growth spurt) (Philippaerts et al., 2006). The mean age range for peak height velocity in European boys is 13.8 to 14.2 years (Malina et al., 2004a). There is good reason to believe that peak gains in RSA will demonstrate a similar developmental trajectory. In support of this argument, the total time for a RSA test (6 x 30-m) improved progressively in elite youth soccer players from U-11 to U-15 age groups with no further significant improvements reported between the U-15 to U-18 age groups (Mujika et al., 2009). Differences in sprint performance are also strongly correlated with variations in body mass and stature between the age groups. In soccer players of 13-14 years, training history, stature, the sitting height to height ratio (proportions) and adiposity accounted for 48% of the variance in the fastest sprint of seven trials (Figueiredo et al., 2011). Inter-individual variability in RSA may also result as a consequence of differences in the timing and tempo of biological maturation, particularly during mid-puberty (Figueiredo et al., 2009b; Malina et al., 2004b). If this is the case, then maturity associated variation in RSA might have important implications for success and, ultimately, the selection of youth players. Youth soccer players 11-12 and 13-14 years who moved to a higher level (elite) reported superior performance in a repeated sprint protocol (7 sprints) compared to peers of the same age who persisted at the same level or who dropped out of the sport (Figueiredo et al., 2009a).
Relationships among growth, maturation and functional capacities of youth soccer players, and their potential implications for athlete selection and development are often discussed in the context of talent identification (Coelho e Silva et al., 2010; Figueiredo, et al., 2009a). The available research pertaining to maturity associated variation in the physical and functional capacities of youth soccer players is, however, largely limited to cross-sectional studies. Furthermore, inter-individual differences in biological maturation (status or timing) are rarely considered in longitudinal studies (Huijgen et al., 2010). The maturity-related differences in the performances of adolescent males in tests of strength, power and speed tend to follow a gradient of early > on time > late maturation (Malina et al., 2004a). Corresponding data regarding the performances of adolescent soccer players are more variable. Portuguese players 11-12 and 13-14 years of contrasting maturity status did not differ in speed, agility, and power and performance in four soccer skills (Figueiredo et al., 2009b); only aerobic endurance assessed by a 20-m intermittent shuttle run protocol differed (late > on time = early). It is important to recognize, however, that these findings are based on cross-sectional data and, as a result, may not reflect maturity associated changes in the physical and functional aptitudes of youth soccer players. Longitudinal data evaluating functional capacities of youth soccer players, specifically RSA, relative to growth and biological maturation are limited. With this in mind, the purpose of this study was to evaluate the longitudinal development of performance in a test of RSA in soccer players from ages 11 to 17 years with specific emphasis on the contributions of chronological age, skeletal maturation, body size, composition, aerobic capacity, lower limb explosive strength and training as potential explanatory variables in a multilevel modeling design.
Methods
Participants and procedures
The present sample included 135 youth soccer players. 83 players aged between 11 and 13 years at baseline were followed on an annual basis, on 3 to 5 occasions (i.e., mixed-longitudinal). An additional independent cross-sectional sample of 52 players 11-17 years was observed on a single occasion (Table 1). The cross-sectional sample served to test the statistical fit of the model derived from the mixed-longitudinal series.
Table 1.
Number of measurements and number of players per age group and maturity status.
| Longitudinal data set Number of measurements |
Control group (1-measurement) |
|||||
|---|---|---|---|---|---|---|
| Age | Maturity status | 3 | 4 | 5 | Total measurements | |
| 11 years | Late | 0 | 4 | 2 | 6 | 2 |
| On Time | 3 | 7 | 13 | 23 | 4 | |
| Early | 0 | 2 | 9 | 11 | 2 | |
| Total | 3 | 13 | 24 | 40 | 8 | |
| 12 years | Late | 0 | 4 | 5 | 9 | 2 |
| On Time | 3 | 12 | 18 | 33 | 4 | |
| Early | 1 | 2 | 12 | 15 | 3 | |
| Total | 4 | 18 | 35 | 57 | 9 | |
| 13 years | Late | 1 | 5 | 5 | 11 | 2 |
| On Time | 7 | 17 | 24 | 48 | 5 | |
| Early | 3 | 5 | 16 | 24 | 3 | |
| Total | 11 | 27 | 45 | 83 | 10 | |
| 14 years | Late | 1 | 5 | 5 | 11 | 1 |
| On Time | 4 | 17 | 24 | 45 | 6 | |
| Early | 3 | 5 | 16 | 24 | 3 | |
| Total | 8 | 27 | 45 | 80 | 10 | |
| 15 years | Late | 1 | 1 | 5 | 7 | 1 |
| On Time | 4 | 10 | 24 | 38 | 6 | |
| Early | 2 | 3 | 16 | 21 | 1 | |
| Total | 7 | 14 | 45 | 66 | 8 | |
| 16 years | Late | 0 | 1 | 3 | 4 | 0 |
| On Time | 0 | 5 | 11 | 16 | 3 | |
| Early | 0 | 3 | 7 | 10 | 1 | |
| Total | 0 | 9 | 21 | 30 | 4 | |
| 17 years | Late | 0 | 0 | 0 | 0 | 0 |
| On Time | 0 | 0 | 6 | 6 | 2 | |
| Early | 0 | 0 | 4 | 4 | 1 | |
| Total | 0 | 0 | 10 | 10 | 3 | |
| Number of measurements | 33 | 108 | 225 | 366 | 52 | |
| Number of players | 11 | 27 | 45 | 83 | 52 | |
| Late | 1 | 5 | 5 | 11 | 8 | |
| On Time | 7 | 17 | 24 | 48 | 30 | |
| Early | 3 | 5 | 16 | 24 | 14 | |
Players were recruited from five local clubs in the midlands of Portugal. Goalkeepers were not included. The clubs participated in a 9-month competitive season (September-May) regulated by the Portuguese Soccer Federation. Teams had 3-5 training sessions (90-120 min.session-1) and played one competitive game per week, usually on Saturday. The players also participated in national level of competitions and could be described as a developmental pool for talent identification. Years of formal participation in soccer was obtained from each player and verified by club records. The Portuguese Soccer Federation records the training history of all players and the corresponding data are publicly available. Annual volume of training was estimated from weekly participation forms completed by each head coach.
The present research was approved by the Portuguese Foundation for Science and Technology [PTDC/DES/121772/2010]. Parents or guardians of the young athletes provided informed consent and players provided assent. Players were informed that participation in the study was voluntary and that they could withdraw at any time.
The data was collected annually within a 2-week period under standard conditions at an indoor facility at the University of Coimbra. Assessments were performed at the same time each day (6:00 PM to 7:00 PM) and were scheduled during school Easter holidays.
Biological maturation
Chronological age (CA) was calculated as the difference between date of birth and date of the hand-wrist radiograph which was used to assess skeletal age (SA). Posterior-anterior radiographs of the left hand-wrist were taken and films were rated using the Fels method for the assessment of SA (Roche et al., 1988). The protocol assigns grades to specific maturity indicators for the radius, ulna, carpals, metacarpals plus phalanges of the first, third and fifth rays, and utilizes ratios of linear measurements of the widths of the epiphysis and metaphysis of the long bones. The presence (ossification) or absence of the pisiform and adductor sesamoid bones is also noted. Grades and ratios are entered into a program (Felshw 1.0 Software, Lifespan Health Research Center, Departments of Community Health and Pediatrics, Boonshoft School of Medicine, Wright State University, Dayton, Ohio) to derive a SA for each subject. The statistical protocol weights the contributions of specific indicators, depending on CA and sex, in calculating an SA and its standard error of estimate (a confidence interval for the assessment). The difference between SA and CA (SA minus CA) was used to classify players into three contrasting maturation categories at the baseline (Malina, 2011; Malina et al., 2010; 2012):
late (delayed), SA younger than CA by > 1.0 yr;
average (on time), SA ± 1.0 yr CA; and
early (advanced), SA older than CA by > 1.0 yr.
Anthropometry
A single individual trained in anthropometric assessment measured body mass, stature and two skinfolds (i.e., triceps and subscapular) following standard procedures (Lohman et al., 1988). Stature was measured to the nearest 0.1 cm with a Harpenden stadiometer (model 98.603, Holtain Ltd, Crosswell, UK) and body mass was measured to the nearest 0.1 kg with a SECA balance (model 770, Hanover, MD, USA). Skinfolds were measured to the nearest mm using a Lange caliper (Beta Technology, Ann Arbor, MI, USA). Technical errors of measurement for body mass (0.47 kg), stature (0. 27 cm) and skinfolds (0.47-0.72 mm) were well within the range of errors in several health surveys in the United States and a variety of field surveys (Malina, 1995). Percentage body fat was estimated from triceps and subscapular skinfold thicknesses (Slaughter et al., 1988). FFM was derived in kg.
Functional capacities
A soccer-specific RSA test known as the Bangsbo Sprint Test (Bangsbo, 1994) was used. The protocol included seven successive 34.2-m maximal sprints (including a slalom). The subject was positioned behind the starting line with the lead foot positioned 0.3 m behind the line. Following each sprint there was a period of active recovery consisting of jogging (25 s to cover the distance of 40 m back to the starting line). Verbal feedback was given at 5, 10, 15, and 20 s across the recovery period. Subsequent sprints were initiated after the end of the recovery interval with the subject positioning the lead foot 0.3 m behind the starting line. The time for each sprint was recorded to 0.01 s with a digital chronometer connected to photoelectric cells (Globus Ergo Timer Timing System, Codogné, Italy). A pair of photocells was positioned along the starting line and another pair was positioned on the finish line, 0.8 m above the floor. Due to discrepancies across studies and absence of a golden standard formula to express the rate of decrement across repeated-sprint tests, performance in the RSA tests was expressed as the sum of the seven sprints (i.e., total sprint time).
All participants performed one familiarization trial of the RSA test in the week before the first and subsequent observations. The best sprint of the familiarization session was retained and participants who failed to achieve at least 95% of the time of the best sprint in the first run in the final testing session were excluded in order to avoid pacing during the test (Bishop et al., 2001; Meckel et al., 2009). All players met the inclusion criterion. Coefficients of reliability for replicate tests of 32 players within one week were 0.86 for ideal time and 0.91 for total time.
Aerobic endurance performance was measured using the 20-m multi-stage continuous shuttle endurance test (Leger et al. , 1988) that included a series of runs following a cadence set by an audio metronome. The time between runs was systematically reduced, thus increasing the effort required to keep the pace. The objective of the test was to perform as many shuttles as possible following the cadence; the test was stopped when the athlete was no longer able to maintain the required pace. The number of fully completed 20- m runs (shuttles) was recorded for analysis. Participants were familiar with the protocol as the test is included in the Portuguese physical education curriculum as part of the FITNESSGRAM battery. Based on a test-retest protocol (one week apart) with 21 players, the coefficient of reliability was 0.86.
Three trials of the counter-movement jump were performed using the ergo-jump protocol (Bosco et al., 1983). The best score was retained for analysis. Participants were instructed to keep the hands on hips from the starting position through counter movement phase, jump and end of the flight trajectory. The reliability for replicate tests derived from 32 players evaluated within 1 week apart was 0.86.
Statistical analysis
Means and standard deviations for years of training, annual volume training, stature, body mass, estimated FFM, sum of 7 sprints, aerobic endurance and counter-movement jump were calculated by year for the mixed-longitudinal sample. Development changes in the total sprint time were investigated using multilevel modeling (MLwiN 2.02). The technique is an extension of multiple regression analysis and is appropriate for analyzing hierarchically structured data. A simple two-level model was defined using the repeated measures (level 1) nested within individual players (level 2). Chronological age at first observation and number of observations (average 4.4 observations per player) were not the same for all athletes (Table 1). The interval between observations was within a two week period separated by one year. Moreover, it is common in longitudinal studies for some individuals to miss a test and for some to drop-out. The multilevel model has an advantage since the number of observations and temporal spacing between measurements can vary among subjects; all available data can thus be incorporated into the analysis. The analysis performed in the current study did not require the same number of measurements occasion per individual. The condition of random dropout was observed and maximum likelihood in MLwiN for Normal data was used as a full information estimation procedure to ignore missingness (Rasbash et al., 1999).
The hierarchical linear model permitted construction of the developmental model of RSA from 11 to 17 years as CAs ranged from 11-13 years at baseline and 13-17 years at the close of observations. Total sprint time was modeled with an additive polynomial model (Nevill et al., 1998; Rasbash et al., 1999) where all parameters were fixed except for the constant and CA, which were allowed to vary randomly between individuals (level 2). A forward stepwise approach was used to derive the predictive model for RSA performance. The first step was to obtain a model that fits non-linear chronological age-related changes. The quadratic term of age squared was the best estimate available to allow for the nonlinear relationship of functional capacities and age (Baxter-Jones et al., 1993). Thus, CA and CA2 were used. Skeletal maturity status at baseline (late, on time, early) was incorporated as an indicator variable. The second step in the multilevel model involved testing the inclusion, one step at a time, of additional explanatory variables (anthropometry, aerobic endurance, lower limb explosive strength, years of training) in order to improve the fit of the multilevel model. Changes in the -2 Log Likelihood (deviance) statistic indicated whether the improvement or reduction in the statistical fit of the model was significant after inclusion or exclusion of a predictor variable. Predictor variables were accepted as significant if the estimated mean coefficient was greater than twice the standard error of the estimate (p<0.05). If the retention criteria were not met, the predictor variable was discarded. The final model included only variables that were significant independent predictors. The validity of the RSA multilevel regression model was evaluated by comparison of predicted and actual RSA scores in the cross-sectional sample of 52 players. Paired sample t-tests were used. Alpha level was set at 0.05.
Results
The distribution of players in the mixed-longitudinal and cross-sectional samples by age and skeletal maturity status is summarized in Table 1. The majority of players in all age groups were classified as "on time" or average in skeletal maturation, but the proportion of players advanced in maturation (early) increased while the proportion of players delayed in maturation (late) decreased with age. Descriptive statistics for years and volume of training, body size, estimated FFM, total sprint time, aerobic endurance and lower limb explosive strength by chronological age group in the mixed-longitudinal sample are summarized in Table 2. As expected, mean values generally improved with age (lower scores for total sprint time indicates better performance).
Table 2.
Mean scores (± SD) of the mixed-longitudinal data set for training experience, anthropometric variables, repeated-sprint ability, aerobic endurance and lower limb explosive strength, by age group.
| Age | n | Years of training (yrs) |
Annual volume training (h) |
Stature (cm) |
Body mass (kg) |
Fat-free mass (kg) |
Sum of 7 sprints (s) |
Aerobic endurance (m) |
Lower limb explosive strength (cm) |
|---|---|---|---|---|---|---|---|---|---|
| 11 years | 40 | 2.5 (0.9) | 111.7 (25.8) | 143.1 (6.0) | 36.4 (5.3) | 32.2 (3.8) | 62.1 (3.4) | 680 (360) | 25.6 (4.2) |
| 12 years | 57 | 3.5 (1.2) | 141.7 (33.2) | 149.3 (7.1) | 40.5 (6.4) | 35.6 (4.9) | 59.2 (3.1) | 960 (360) | 27.8 (5.0) |
| 13 years | 83 | 4.5 (1.1) | 147.7 (52.5) | 158.0 (8.1) | 47.4 (8.6) | 41.4 (6.5) | 57.6 (3.1) | 1140 (320) | 30.6 (5.3) |
| 14 years | 80 | 5.5 (1.1) | 167.1 (49.2) | 164.9 (7.6) | 53.7 (8.5) | 46.7 (6.4) | 55.1 (2.3) | 1320 (380) | 32.9 (5.0) |
| 15 years | 66 | 6.6 (1.1) | 168.9 (48.7) | 169.9 (6.4) | 59.9 (8.6) | 51.4 (5.4) | 53.7 (2.2) | 1520 (320) | 35.3 (4.7) |
| 16 years | 30 | 7.3 (1.4) | 185.2 (46.8) | 172.5 (5.2) | 64.4 (9.6) | 54.2 (5.6) | 52.0 (2.4) | 1620 (220) | 37.3 (5.6) |
| 17 years | 10 | 8.2 (1.1) | 187.9 (40.8) | 173.7 (4.2) | 68.0 (9.4) | 56.8 (6.1) | 51.4 (2.2) | 1720 (120) | 35.9 (2.6) |
Predicted RSA scores derived from the multilevel model are summarized in Table 3. After a sequence of 11 steps, the following effects were selected as significant contributors in the final model (Log Likelihood = 1500.47): CA (p < 0.01), CA2 (p < 0.01), skeletal maturity status (p < 0.01), FFM (p < 0.01), body mass (p < 0.01), stature (p < 0.05), aerobic endurance (p < 0.01), lower limb explosive strength (p < 0.01) and annual volume training (p < 0.05). The random slopes improved the model fit (p < 0.01) suggesting that the relationships among CA, maturity status and RSA performance varied across individual players.
Table 3.
Multilevel model for the repeated-sprint ability (366 measurements).
| Step | Fixed Effects | Log Likelihood | P | At Final Step | |
|---|---|---|---|---|---|
| Coefficient | SE | ||||
| 1 | Intercept (constant) | 2065.16 | 86.54 | 6.76 | |
| 2 | Chronological age | 1604.11 | <.01 | – 2.87 | 1.11 |
| 3 | Chronological age2 | 1595.37 | <.01 | .06 | .04 |
| 4 | Late | 0 | |||
| On time | – .64 | .60 | |||
| Early | 1585.85 | <.01 | – 1.74 | .70 | |
| 5 | Lean body mass | 1578.69 | <.01 | – .25 | .07 |
| 6 | Body mass | 1554.02 | <.01 | .15 | .05 |
| 7 | Height | 1549.64 | <.05 | .06 | .04 |
| 8 | Aerobic endurance | 1518.04 | <.01 | – .05 | .01 |
| 9 | Lower limb explosive strength | 1505.35 | <.01 | – .09 | .03 |
| 10 | Training experience | 1503.03 | .13 | N.E. | |
| 11 | Annual volume training | 1500.47 | <.05 | – .01 | .00 |
| Random Effects | Variance | SE | |||
| Residual variance (level 1) | 2.22 | .21 | |||
| Intercept slope variance (level 2) | 37.07 | 15.10 | |||
| Deviance from the empty model | 564.69 | ||||
| p < .001 | |||||
SE (standard error); N.E. (not entered).
Equations for the three skeletal maturity groups at baseline were also derived. The best fitting model for RSA in late maturing players was expressed in the following equation: sum of seven sprints (in seconds) = 86.54 - 2.87 x CA + 0.05 x CA2 - 0.25 x FFM + 0.15 x body mass + 0.05 x stature - 0.05 x aerobic endurance - 0.09 x lower limb explosive strength - 0.01 x annual volume training. The best models for players on time and early in maturity status were the same as for late maturing players less 0.64 and 1.74 seconds, respectively.
It was also possible to predict improvements over time using the multilevel model. Independent of maturity status, total repeated-sprint time of the youth soccer players decreased (i.e., improved) by about 2.87 ± 0.06 seconds (mean ± SD) per year from 11 to 17 years.
Predicted mean RSA times derived from the multilevel model are plotted by skeletal maturity status at the baseline within age group in Figure 1. Performance improved from 11 to 17 years for each maturity group but differences among maturity groups were significant only at 12 to 14 years of age (p < 0.05).
Figure 1.
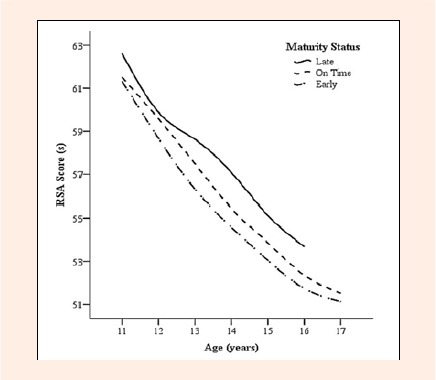
Estimated RSA scores in young soccer players by skeletal maturity groups.
Cross-validation of the RSA prediction equations in the independent control group is summarized in Table 4. Allowing for variation in sample sizes within CA groups, actual and predicted RSA times of players did not significantly differ for the total sample or among players of contrasting maturity status within CA groups.
Table 4.
Validity of the model based on the difference between real scores (± SD) and predicted scores (± SD) for the repeated-sprint ability of the control group.
| Control group | Model | ||||
|---|---|---|---|---|---|
| Maturity status | RSA real score (s) | Predicted score (s) | Difference (s) | t | p |
| Late | 59.01 (3.30) | 59.10 (3.90) | – .09 (1.06) | – .23 | n.s. |
| On Time | 56.17 (3.61) | 56.28 (3.69) | – .10 (1.29) | – .44 | n.s. |
| Early | 55.54 (4.05) | 55.40 (4.30) | .15 (.79) | .70 | n.s. |
| Total | 56.44 (3.79) | 56.47 (4.00) | – .03 (1.13) | – .21 | n.s. |
n.s. nonsignificant
Discussion
Developmental changes in performance in a RSA test across adolescence were evaluated in youth soccer players, taking into account chronological age, skeletal maturity status, measurements of body size, lower limb explosive strength and training experience. Total sprint time improved progressively with age. Performance also varied with skeletal maturity status at baseline and followed a gradient of early > on time > late. This observation is consistent with maturity-associated changes in the stature, body mass, static and functional strength, power and running speed of youth soccer players (Figueiredo et al., 2009b; Malina et al., 2000; 2004a). The apparent independent effect of chronological age and skeletal maturity status contrasted observations from cross-sectional studies that emphasized height and body mass as predictors of inter-individual variability in RSA (Mujika et al., 2009).
The results of the current study also suggest that the effect of body size and muscle mass on short-term power output may be attributable to variance in skeletal maturity status. Moreover, aerobic endurance performance and training were also found to be independent predictors of improved RSA performance across adolescence.
The age-related trend towards the success and/or selection of early in contrast to late maturing males is consistent with previous research in soccer (Hirose, 2009; le Gall et al., 2010; Malina, 2011) and in other sports with the exception of gymnastics (Malina, 2011). In the present study, late and early maturing boys were, in general, equally represented among youth players 11 and 12 years. With increasing age through adolescence, the present players who were on time (average) and/or advanced in SA were more likely to be represented, whereas boys late in SA were underrepresented in the sample. This trend may reflect selective retention and/or exclusion (self and/or coach) in youth soccer. Among Portuguese youth players, boys who moved to elite status were more advanced in SA than those who remained with the same club who in turn were more advanced in SA than those who dropped out of the sport (Figueiredo et al., 2009a). Selected Japanese youth players were advanced in SA compared to those not selected (Hirose, 2009). The trend was also evident in a cross-sectional study comparing 135 Portuguese elite youth soccer players 10-16 years of age (Malina et al., 2000).
Comparison of RSA among players of contrasting maturity status was concentrated at 12-14 years for the sum of seven sprints and 13-15 years for the lower limb explosive strength, which was also a predictor of the developmental changes in RSA. This may reflect individual differences in the timing of adolescent spurts in body size, fat-free and muscle mass, running speed, and power (Malina et al., 2004a). Though data are limited to a longitudinal study of Belgian boys, explosive power of the lower extremities (vertical jump) attains maximal growth velocity after peak height velocity, whereas peak gains in a shuttle run occur prior to peak height velocity (Beunen and Malina, 1988). Unfortunately, the present data set does not permit estimates of the timing of maximal growth (peak velocities) in height, repeated sprints and explosive power of the lower extremities.
Previous longitudinal studies have highlighted the influence of changes in stature and body mass on mean and peak power assessed by a short-term power outputs (Armstrong and Welsman, 2000; Falk and Bar-Or, 1993). In the current study, total body mass, estimated FFM and stature were significant predictors of developmental changes in RSA performance in youth soccer players. Mean relative fatness (densitometry, total body water) of four samples of elite young adult soccer players ranged from 6. 2 ± 1.9% to 9.7 ± 3.0% (Malina, 2007), while an estimate for adolescent players (mean 16.8 yrs) was 9.6% (Malina and Geithner, 2011). Players who attained better performances in sprint tests tended to have a lower percentage of body fat (Reilly et al., 2000), and by inference a higher FFM percentage. Of relevance, estimated FFM significantly improved the statistical fit of the multilevel model. From 11 to 17 years, each unit increase in FFM (in kg) corresponded to an improvement of 0.25 seconds in predicted total sprint time. One should note, however, FFM was derived from percentage fat predicted from skinfold thicknesses. Mean relative fatness of samples of youth soccer players about 11-18 years ranged from 11.3% to 15.8% (Malina and Geithner, 2011) and were consistently higher than estimates based on more direct methods for estimating body composition.
Consistent with results in the current study, lower limb strength has been shown to produce a positive influence on the speed of changing direction over short distances (Negrete and Brophy, 2000). Meantime, the aerobic energy system is considered an important determinant in recovery rate from intense activity and therefore assists in power output maintenance during the repeated-sprint test as performance relies on the limitations of the energy supply (Bishop et al., 2011; Girard et al., 2011; Spencer et al., 2005). Recent reviews on the relationship between aerobic fitness and RSA in athletes from team sports have produced contrasting results, which varied from non-significant to moderate associations (0.42 < r < 0.68; p < 0.05) (Bishop et al., 2011; Glaister, 2005). Other studies, showed that the duration of recovery time between sprints influenced oxygen uptake during RSA activities (Aziz et al., 2007; Meckel et al., 2009), but results were inconsistent. The studies used different protocols which may have influenced the results. The first study (Aziz et al., 2007) used a shorter sprint length (20 meters) and a shorter recovery time between sprints (e.g. 20 seconds) which may not have permitted sufficient time for aerobic metabolism to exert a large influence of phosphocreatine repletion within the muscles. However, the aerobic system is more related to power maintenance in an intermittent activity with a high number of short repetitions (12 x 20 meters) compared to a protocol with a low number of repetitions (6 x 40 meters) (Meckel et al., 2009). Also, the mode of recovery (passive or active) can potentially affect subsequent high-intensity performance, since oxygen uptake and phosphocreatine resynthesis during these efforts are markedly restricted by active recovery (Dupont et al., 2004). Although many issues remain unresolved, the present study suggested that the level of aerobic endurance performance is a significant and independent predictor (see Table 3, step 8) of the total sprint time of youth soccer players.
Several limitations associated with this study should be noted. First, the sample size was relatively small and only represented players who had agreed to participate in the study. It should be noted, however, that any selection bias would have been minimized by the high response rate. Also, the simultaneous inclusion of players who were and were not selected by trainers for the regional team might enable the use of the performance curves at more elite levels of practice. Additional research is needed to examine the fitness of the performance curves in other groups of youth soccer players by playing position and competitive level. Another potential methodological limitation was the use of the 20-m multi-stage continuous shuttle run as an indirect indicator of aerobic performance. Nevertheless, recent findings suggested that directly measured VO2max was not a sufficiently sensitive indicator of aerobic fitness in soccer players (Edwards et al., 2003). Finally, players were not studied beyond 17 years so that continued improvement in RSA performance in late adolescence and into young adulthood could not be addressed. The trends derived from the model (Figure 1) suggested that development of RSA performance proceeded in a more curvilinear fashion with a smaller rate of improvement with increasing age. Whether this development barely improves after the 17 years of age, is unknown. This needs to be addressed in a sample of youth players that continues into later adolescence and perhaps early adulthood. On the other hand, players identified as being the most ‘talented’ during early-adolescence may fail to meet future expectations as late-maturing peers who persist in the sport catch-up in size, strength and power (Malina et al., 2004a). The latter, of course, assumes late maturing youth continue in the sport, a trend that was not quite evident in this sample (Table 1) and other samples of youth soccer players (Malina, 2011).
Conclusion
The present study assessed the total sprint time development of individual players in a mixed-longitudinal design that considered s everal factors that contribute to the performance in a RSA test across adolescence (i.e. CA, CA2, skeletal maturity status, FFM, body mass, stature, aerobic endurance, lower limb explosive strength and annual volume training). The utility of multilevel modeling was evident in the cross-validation with the cross-sectional sample in which a difference of only 0.03 s was observed between predicted and actual total sprint time scores. Thus, the performance curves based on the multilevel model provided a potentially valuable reference against which performance in individual soccer players can be compared. This may be useful to trainers and coaches in advising training protocols for individual players.
Acknowledgements
This study was supported in part by the Portuguese Foundation for Science and Technology [SFRH/BD/64648/2009, PTDC/DTP-DES/1178/2012].
Biographies

João Valente-dos-Santos
Employment
PhD-candidate, Faculty of Sport Sciences and Physical Education, University of Coimbra
Degree
MSc
Research interest
Longitudinal performance analysis.
E-mail: jvsantos@fcdef.uc.pt

Manuel J. Coelho-e-Silva
Employment
Associate professor, Faculty of Sport Sciences and Physical Education, University of Coimbra
Degree
PhD
Research interest
Auxology and Pediatric Sport Science
E-mail: mjcesilva@fcdef.uc.pt

Vítor Severino
Employment
PhD-candidate, Faculty of Sport Sciences and Physical Education, University of Coimbra
Degree
MSc
Research interest
Soccer. Field and laboratory assessments
E-mail: vitorjss@gmail.com

João Duarte
Employment
Faculty of Sport Sciences and Physical Education, University of Coimbra
Degree
MSc - candidate
E-mail: 123jp4@gmail.com

Raúl S. Martins
Employment
Assistant professor, Faculty of Sport Sciences and Physical Education, University of Coimbra
Degree
PhD
Research interest
Research design
E-mail: raulmartins@fcdef.uc.pt

António J. Figueiredo
Employment
Dean, Faculty of Sport Sciences and Physical Education, University of Coimbra
Degree
PhD
Research interest
Soccer, young athletes.
E-mail: afigueiredo@fcdef.uc.pt

André T. Seabra
Employment
Assistant professor, Faculty of Sports, University of Porto
Degree
PhD
Research interest
Anthropometry, youth sports.
E-mail: aseabra@fade.up.pt

Renaat M. Philippaerts
Employment
Professor, Faculty of Medicine and Health Sciences, Ghent University
Degree
PhD
Research interest
Talent identification and development.
E-mail: renaat.philippaerts@UGent.be

Sean P Cumming
Employment
Professor, University of Bath
Degree
PhD
Research interest
Psychology, growth and maturation.
E-mail: sc325@bath.ac.uk

Marije Elferink-Gemser
Employment
Assistant professor, Center for Human Movement Sciences, University of Groningen
Degree
PhD
Research interest
Talent identification and development.
E-mail: M.T.Elferink-Gemser@med.umcg.nl

Robert M. Malina
Employment
Professor Emeritus, University of Texas; Research Professor, Tarleton State University
Degree
PhD (PE and Anthropology)
Research interest
Growth, maturation and physical activity.
E-mail: rmalina@1skyconnect.net
References
- Armstrong N., Welsman J.R.(2000)Anaerobic performance. In: Paediatric exercise science and medicine. Eds: Armstrong N., Mechelen W.V.Oxford: Oxford University Press; 37–46 [Google Scholar]
- Aziz A.R., Mukherjee S., Chia M.Y., Teh K.C.(2007) Relationship between measured maximal oxygen uptake and aerobic endurance performance with running repeated sprint ability in young elite soccer players. The Journal of Sports Medicine and Physical Fitness 47(4), 401–407 [PubMed] [Google Scholar]
- Bangsbo J.(1994)Fitness training in football: a scientific approach. H.O. and Storm, Bagsvaerd [Google Scholar]
- Baxter-Jones A., Goldstein H., Helms P.(1993) The development of aerobic power in young athletes. Journal of Applied Physiology 775(3),1160-1167 [DOI] [PubMed] [Google Scholar]
- Beunen G., Malina R.M.(1988) Growth and physical performance relative to the timing of the adolescent spurt. Exercise and Sport Sciences Reviews 16, 503–540 [PubMed] [Google Scholar]
- Bishop D., Girard O., Mendez-Villanueva A.(2011) Repeated-sprint ability - Part II: Recommendations for training. Sports Medicine 441(9), 741–756 [DOI] [PubMed] [Google Scholar]
- Bishop D., Spencer M., Duffield R., Lawrence S.(2001) The validity of a repeated sprint ability test. Journal of Science and Medicine in Sport / Sports Medicine Australia 44(1), 19–29 [DOI] [PubMed] [Google Scholar]
- Bosco C., Luhtanen P., Komi P.V.(1983) A simple method for measurement of mechanical power in jumping. European Journal of Applied Physiology and Occupational Physiology 50, 273–282 [DOI] [PubMed] [Google Scholar]
- Buchheit M., Mendez-Villanueva A., Simpson B.M., Bourdon P.C.(2010a) Match running performance and fitness in youth soccer. International Journal of Sports Medicine 31, 818–825 [DOI] [PubMed] [Google Scholar]
- Buchheit M., Mendez-villanueva A., Simpson B.M., Bourdon P.C.(2010b) Repeated-sprint sequences during youth soccer matches. International Journal of Sports Medicine 31, 709–716 [DOI] [PubMed] [Google Scholar]
- Carling C., Le Gall F., Dupont G.(2012) Analysis of repeated high-intensity running performance in professional soccer. Journal of Sports Science 30, 325–336 [DOI] [PubMed] [Google Scholar]
- Coelho e Silva M.J., Figueiredo A.J., Simoes F., Seabra A., Natal A., Vaeyens R., Philippaerts R., Cumming S.P., Malina R.M.(2010) Discrimination of u-14 soccer players by level and position. International Journal of Sports Medicine 31, 790–796 [DOI] [PubMed] [Google Scholar]
- Dupont G., Moalla W., Guinhouya C., Ahmaidi S., Berthoin S.(2004) Passive versus active recovery duting high-intensity intermittent exercises. Medicine and Science in Sports and Exercise 36, 302–308 [DOI] [PubMed] [Google Scholar]
- Edwards A.M., Clark N., Macfadyen A.M.(2003) Lactate and ventilatory thresholds reflect the training status of professional soccer players where maximum aerobic power is unchanged. Journal of Sports Science and Medicine 2, 23–29 [PMC free article] [PubMed] [Google Scholar]
- Elferink-Gemser M.T., Visscher C., Lemmink K.A., Mulder T.(2007) Multidimensional performance characteristics and standard of performance in talented youth field hockey players: a longitudinal study. Journal of Sports Sciences 25, 481–489 [DOI] [PubMed] [Google Scholar]
- Falk B., Bar-Or O.(1993) Longitudinal changes in peak aerobic and anaerobic mechanical power of circumpubertal boys. Pediatric Exercise Science 5, 318–331 [Google Scholar]
- Figueiredo A.J., Coelho-e-Silva M.J., Malina R.M.(2011) Predictors of functional capacity and skill in youth soccer players. Scandinavian Journal of Medicine & Science in Sports 21, 446–454 [DOI] [PubMed] [Google Scholar]
- Figueiredo A.J., Goncalves C.E., Coelho-e-Silva M.J., Malina R.M.(2009a) Characteristics of youth soccer players who drop out, persist or move up. Journal of Sports Science 27, 883–891 [DOI] [PubMed] [Google Scholar]
- Figueiredo A.J., Goncalves C.E., Coelho-e-Silva M.J., Malina R.M.(2009b) Youth soccer players, 11-14 years: maturity, size, function, skill and goal orientation. Annals of Human Biology 36, 60–73 [DOI] [PubMed] [Google Scholar]
- Girard O., Mendez-Villanueva A., Bishop D.(2011) Repeated-sprint ability - part I: factors contributing to fatigue. Sports Medicine 441(8), 673–694 [DOI] [PubMed] [Google Scholar]
- Glaister M.(2005) Multiple sprint work: physiological responses, mechanisms of fatigue and the influence of aerobic fitness. Sports Medicine 335(9), 757–777 [DOI] [PubMed] [Google Scholar]
- Hirose N.(2009) Relationships among birth-month distribution, skeletal age and anthropometric characteristics in adolescent elite soccer players. Journal of Sports Sciences 27, 1159-1166 [DOI] [PubMed] [Google Scholar]
- Huijgen B.C., Elferink-Gemser M.T., Post W., Visscher C.(2010) Development of dribbling in talented youth soccer players aged 12-19 years: a longitudinal study. Journal of Sports Sciences 28, 689–698 [DOI] [PubMed] [Google Scholar]
- Huijgen B.C., Elferink-Gemser M.T., Post W.J., Visscher C.(2009) Soccer skill development in professionals. International Journal of Sports Medicine 330(8), 585–591 [DOI] [PubMed] [Google Scholar]
- le Gall F., Carling C., Williams M., Reilly T.(2010) Anthropometric and fitness characteristics of international, professional and amateur male graduate soccer players from an elite youth academy. Journal of Science and Medicine in Sport / Sports Medicine Australia 13, 90–95 [DOI] [PubMed] [Google Scholar]
- Leger L.A., Mercier D., Gadoury C., Lambert J.(1988) The multistage 20 metre shuttle run test for aerobic fitness. Journal of Sports Sciences 6, 93–101 [DOI] [PubMed] [Google Scholar]
- Lohman T.G., Roche A.F., Martorell R.(1988)Anthropometric standardization reference manual. Human Kinetics, Champaign: [Google Scholar]
- Malina R.M.(1995)Anthropometry. In: Physiological Assessment of Human Fitness, Eds. Maud P.F., Foster C.Champaign IL: Human Kinetics, 205–219 [Google Scholar]
- Malina R.M.(2007) Body composition in athletes: assessment and estimated fatness. Clinics in Sports Medicine 226, 37–68 [DOI] [PubMed] [Google Scholar]
- Malina R.M.(2011) Skeletal age and age verification in youth sport. Sports Medicine 41, 925–947 [DOI] [PubMed] [Google Scholar]
- Malina R., Bouchard C., Bar-Or O.(2004a)Growth, maturation, and physical activity, 2nd edition. Human Kinetics, Champaign: [Google Scholar]
- Malina R.M., Coelho e Silva M.J., Figueiredo A., Carling C.(2012) Interrelationships among invasive and non-invasive indicators of biological maturation in adolescent male soccer players. Journal of Sports Sciences. (In press) [DOI] [PubMed] [Google Scholar]
- Malina R.M., Eisenmann J.C., Cumming S.P., Ribeiro B., Aroso J.(2004a) Maturity-associated variation in the growth and functional capacities of youth football (soccer) players 13-15 years. European Journal of Applied Physiology 91, 555–562 [DOI] [PubMed] [Google Scholar]
- Malina R.M., Geithner C.A.(2011) Body composition of young athletes. American Journal of Lifestyle Medicine 5, 262–278 [Google Scholar]
- Malina R.M., Pena Reyes M.E., Eisenmann J.C., Horta L., Rodrigues J., Miller R.(2000) Height, mass and skeletal maturity of elite Portuguese soccer players aged 11-16 years. Journal of Sports Sciences 18, 685–693 [DOI] [PubMed] [Google Scholar]
- Malina R.M., Pena Reyes M.E., Figueiredo A.J., Coelho-e-Silva M.J., Horta L., Miller R., Chamorro M., Serratosa L., Morate F.(2010) Skeletal age in youth soccer players: implication for age verification. Clinical Journal of Sport Medicine 20, 469–474 [DOI] [PubMed] [Google Scholar]
- Meckel Y., Machnai O., Eliakim A.(2009) Relationship among repeated sprint tests, aerobic fitness, and anaerobic fitness in elite adolescent soccer players. The Journal of Strength and Conditioning Research 223(1), 163–169 [DOI] [PubMed] [Google Scholar]
- Mujika I., Spencer M., Santisteban J., Goiriena J.J., Bishop D.(2009) Age-related differences in repeated-sprint ability in highly trained youth football players. Journal of Sports Science 227(14), 1581-1590 [DOI] [PubMed] [Google Scholar]
- Negrete R., Brophy J.(2000) The relationship between isokinetic open and closed chain lower extremity strength and functional performance. Journal of Sport Rehabilitation 99, 46–61 [Google Scholar]
- Nevill A.M., Holder R.L., Baxter-Jones A., Round J.M., Jones D.A.(1998) Modeling developmental changes in strength and aerobic power in children. Journal of Applied Physiology 884, 963–970 [DOI] [PubMed] [Google Scholar]
- Philippaerts R.M., Vaeyens R., Janssens M., Van Renterghem B., Matthys D., Craen R., Bourgois J., Vrijens J., Beunen G., Malina R.M.(2006) The relationship between peak height velocity and physical performance in youth soccer players. Journal of Sports Science 224, 221–230 [DOI] [PubMed] [Google Scholar]
- Rampinini E., Bishop D., Marcora S.M., Ferrari Bravo D., Sassi R., Impellizzeri F.M.(2007) Validity of simple field tests as indicators of match-related physical performance in top-level professional soccer players. International Journal of Sports Medicine 28, 228–235 [DOI] [PubMed] [Google Scholar]
- Rasbash J., Browne W., Goldstein H., Yang M., Plewis I., Draper D., Healy M., Woodhouse E.(1999)A user's guide to MLwiN. Institute of Education, London: [Google Scholar]
- Reilly T., Bangsbo J., Franks A.(2000) Anthropometric and physiological predispositions for elite soccer. Journal of Sports Science 118(9), 669–683 [DOI] [PubMed] [Google Scholar]
- Roche A.F., Chumlea C.W., Thissen D.(1988) Assessing the skeletal maturity of the hand-wrist: Fels method. C.C. Thomas, Springfield: [DOI] [PubMed] [Google Scholar]
- Roescher C.R., Elferink-Gemser M.T., Huijgen B.C., Visscher C.(2010) Soccer endurance development in professionals. International Journal of Sports Medicine 331(3), 174–179 [DOI] [PubMed] [Google Scholar]
- Slaughter M.H., Lohman T.G., Boileau R.A., Horswill C.A., Stillman R.J., Van Loan M.D., Bemben D.A.(1988) Skinfold equations for estimation of body fatness in children and youth. Human Biology 60, 709–723 [PubMed] [Google Scholar]
- Spencer M., Bishop D., Dawson B., Goodman C.(2005) Physiological and metabolic responses of repeated-sprint activities: specific to field-based team sports. Sports Medicine 335(12), 1025-1044 [DOI] [PubMed] [Google Scholar]
- Williams A.M., Reilly T.(2000) Talent identification and development in soccer. Journal of Sports Science 18, 657–667 [DOI] [PubMed] [Google Scholar]


