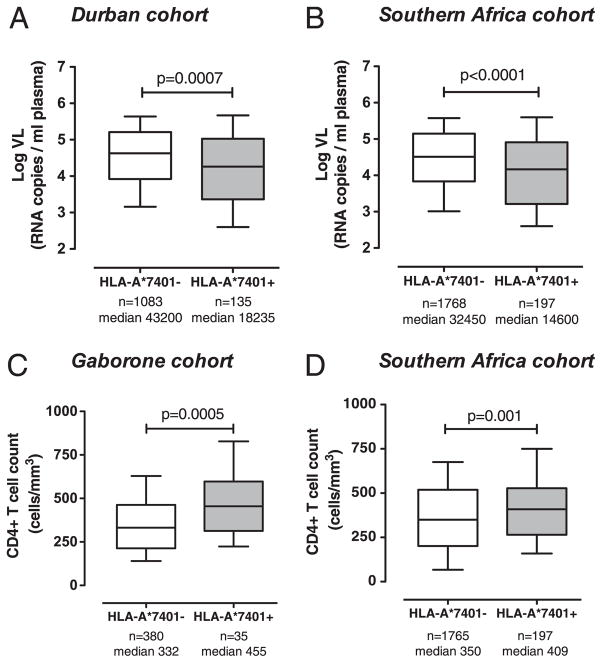
FIGURE 2.
Viral load (VL) and CD4+ T cell count in the presence and absence of HLA-A*7401 in adults with chronic HIV-1 C-clade infection in southern African cohorts. A, VL in Durban, South Africa. B, VL in pooled southern Africa cohort (Durban, South Africa; Gaborone, Botswana; Thames Valley subjects from southern Africa [Botswana, Malawi, South Africa, and Zimbabwe]). C, CD4+ T cell count in Gaborone, Botswana. D, CD4+ T cell count in pooled southern Africa cohort (as above). Median VL (RNA copies/ml plasma) or CD4+ T cell count (cells/mm3) for each group is stated. Boxes show median, 25th and 75th percentile; whiskers 10th–90th percentile. The p values by Mann–Whitney U test.

