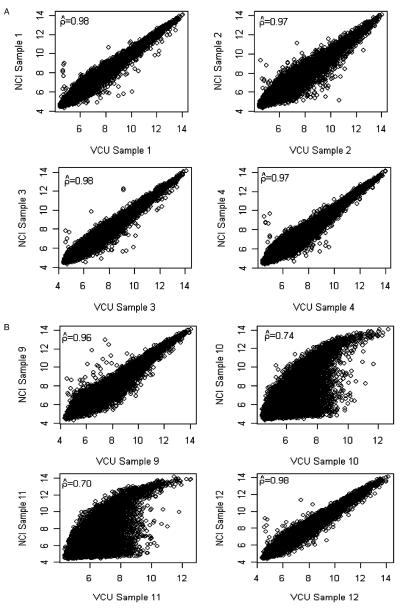
FIGURE 4.
A, Representative pairwise scatterplots for samples 1 to 4 of probe set expression summaries obtained using the RMA method for VCU and NCI hybridized samples. B, Pairwise scatterplots for samples 9 to 12 of probe set expression summaries obtained using the RMA method for VCU and NCI hybridized samples. NCI indicates National Cancer Institute; RMA, robust multiarray average; VCU, Virginia Commonwealth University.

