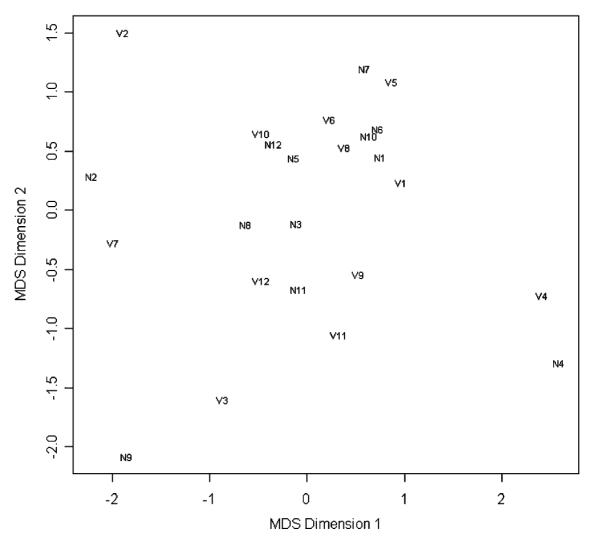
FIGURE 5.

Plot of first and second coordinates from multi-dimensional scaling applied to the 28S:18S rRNA ratios, RIN, and A260:A280 quality metrics reactions were examined to identify whether prechip quality measures identified VCU10 and VCU11 would be outlying with respect to quality. For each point plotted, “V” indicates a VCU processed sample, whereas “N” indicates an NCI processed sample. NCI indicates National Cancer Institute; RIN, RNA integrity number; VCU, Virginia Commonwealth University.
